AI UGC Video Tools Market Analysis Report

Executive Summary
Traffic is concentrated: Vora (1,382,204 visits), Arcads (609,185), and PostSyncer (327,821) together capture over 70% of measured AI UGC Video Tools demand, so the primary distribution gates are already defined.
Thirteen of the 33 listed tools recorded zero visits this month, leaving nearly two-fifths of the catalog without measurable engagement and forcing investors to separate shelf listings from live funnels.
Search delivers the largest share for Vora, PostSyncer, Tagshop AI, Viral Ecom Adz, Vidguru, UGC Ads AI, CloneViral, and Framia, while only Arcads and Airpost lean direct, so competition is happening on intent capture rather than feature breadth.
Framia’s entire 3.12x MoM lift rides on search with no supporting direct, social, or referral traffic, framing the spike as volatility instead of a structural channel shift.
The United States remains the top traffic source for nine of the ten largest tools and still supplies 16.2% of Vora’s demand, indicating that global marketing narratives outpace current regional usage mixes even though other regions do contribute.
MoM change spans EzUGC at +4.40x to Make Movie AI at -0.70x, with seven properties above 3x and four down more than 20%, so most “breakouts” are single-month shocks.
PostSyncer retains the number-three slot with 327,821 visits despite a 77.1% decline from roughly 1.43M, showing how rank tables can mask distribution risk.
Zero-traffic shelf space and search lock-in signal that builders either secure high-intent surfaces or partner with the incumbent trio; net-new creation features alone have not moved distribution yet.
Demand Stack
Observation — Traffic in AI UGC Video Tools still funnels through Vora (a Sora-style enhancer promising watermark-free creation) at 1,382,204 visits, Arcads (an AI actor ad studio) at 609,185, and PostSyncer (an AI social scheduler with viral video generation) at 327,821, so buyers enter the category through the same three doors.
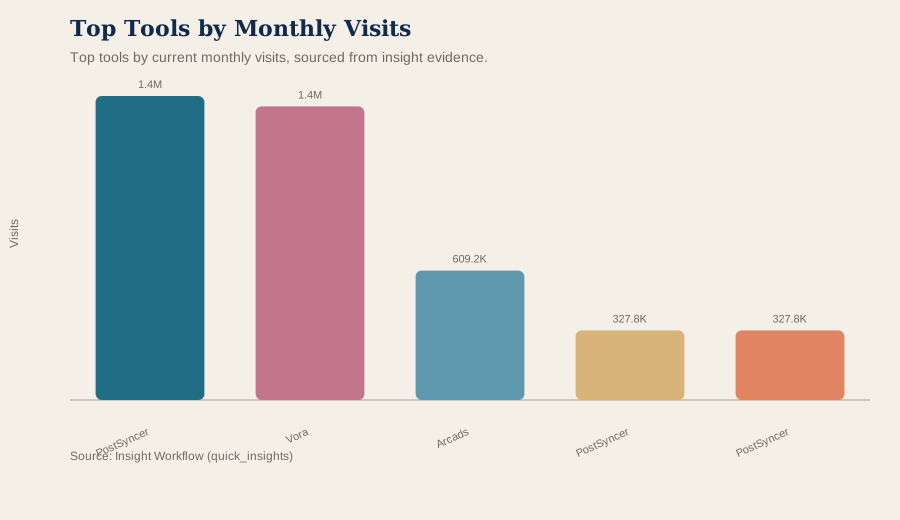
Top tools by current monthly visits, sourced from insight evidence.
Why it matters: Concentrated discovery keeps challengers dependent on incumbent surfaces for awareness. Operator takeaway: Pursue OEM, marketplace, or affiliate deals with the trio before scaling standalone spend.
Analysis — The remaining 30 tools average 83,018 visits while 13 registered zero activity, creating a productive head and a 39% long tail that users rarely encounter. Zero visits may reflect either tracking gaps or dormant products, so catalog placement alone is no longer evidence of reach. Because the dataset reports visits per property rather than unique buyers, duplicated audiences can inflate mid-tier totals and further compress true reach outside the leaders.
Decision impact — Founders should benchmark against the incumbents’ blended funnels, investors should treat zero-traffic entries as optionality until independent demand appears, and product teams need to trade distribution (white-labeling for agencies, marketplace embeds, or co-selling with the triopoly) ahead of expecting organic lift.
Channel Gravity
Observation — Search supplies the majority of visits for Vora, PostSyncer, Tagshop AI (an avatar-based ads studio), Viral Ecom Adz (an e-commerce ad editing service), Vidguru (an all-in-one AI creative suite), UGC Ads AI (a rapid UGC ad generator), CloneViral, and Framia (an AI editor you brief conversationally), while only Arcads and Airpost rely on direct traffic, so acquisition battles are being fought in SERPs across product archetypes.
Analysis — Framia pulls 100% of visits from search with zero direct, social, or referral contribution, meaning its 3.12x MoM lift can vanish on the next ranking change. Arcads, which turns scripts into AI-actor ads, shows that outbound and enterprise relationships can still sustain a direct-led funnel, yet only Airpost shares that profile so far. Tagshop AI’s avatar-driven ads suite and Viral Ecom Adz’s editing service remain tethered to SEO even with distinct creative workflows, confirming that narrative differentiation has not cracked a new acquisition channel.
Decision impact — Builders need programmatic SEO, content syndication, and intent-capture instrumentation in place before code freeze; investors should diligence how defensible each search footprint is; PMs should assume share gains require SERP experimentation rather than feature checklists, and any team chasing the scarce direct-led path must budget for sales cycles comparable to Arcads’ enterprise motion.
Region Lock
Observation — The United States is the top traffic source for Vora (16.2%), Arcads (26.2%), PostSyncer (24.6%), Vidguru (32.1%), and nine of the ten highest-traffic tools, so scaled properties remain US-first even though they market globally.
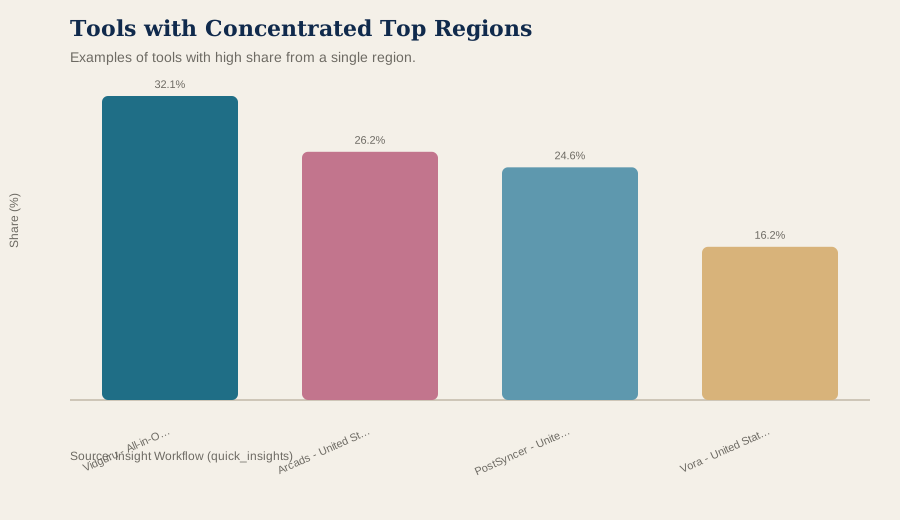
Examples of tools with high share from a single region.
Why it matters: Relying on one region concentrates macro, regulatory, and currency risk instead of diversifying it. Operator takeaway: Sequence US localization, support, and compliance before funding other regional playbooks to avoid assuming automatic spillover.
Analysis — The dataset lists the US as the #1 source for nine of the top ten tools, and even the leader with the lowest US share still depends meaningfully on that market, so there is no evidence yet that another geography carries a scaled funnel. Other regions do contribute traffic, but until a different primary region appears, global TAM narratives remain speculative upside. Vidguru’s promise of one subscription for AI video, image, and audio creation still follows the same US-heavy pattern, showing that consumer-friendly bundles are not bypassing localization hurdles either.
Decision impact — Non-US founders should underwrite US entity setup, revenue operations, and creator relationships early, investors need to haircut pitches that assume rapid ex-US scaling until the top-source ranking changes, and enterprise PMs should treat these vendors as US suppliers for compliance planning until another region becomes primary.
Market Signals
Observation — EzUGC posted the fastest single-month MoM move at +4.40x while Make Movie AI declined -0.70x, with seven tools above 3x growth and four down more than 20%, so the leaderboard mostly reflects short-term volatility.
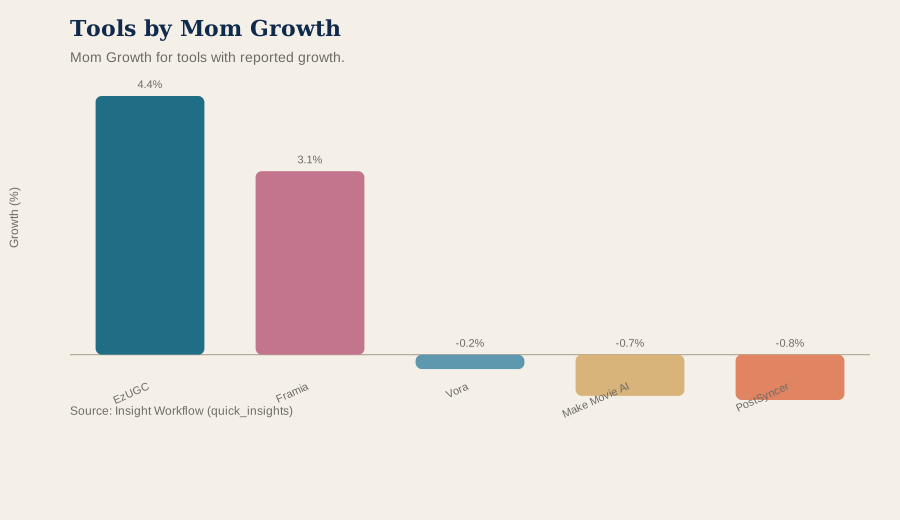
Mom Growth for tools with reported growth.
Why it matters: Planning off last month’s winners risks misallocating spend when another tool catches the next traffic shock. Operator takeaway: Keep budgets modular so resources can be redeployed toward whichever partner is spiking without creating sunk-cost drag.
Analysis — PostSyncer fell 77.1% MoM from roughly 1.43M visits to 327,821 yet still ranks third, Vora slipped 24%, and Framia ballooned 3.12x without diversifying channels, showing that incumbents and challengers alike are exposed to immediate shocks. Because these comparisons capture only a single month, they are volatility cues rather than structural verdicts, but the amplitude alone justifies defensive planning. Make Movie AI’s contraction shows how quickly niche plays drop out of procurement conversations once discovery dries up.
Decision impact — Developers integrating these platforms need failover plans for partner contractions, investors should value multi-channel durability over one-month spikes, and PMs should dual-track procurement with a stable incumbent like Vora plus a high-beta option like EzUGC, codifying kill-switch metrics tied to MoM traffic before another 77% drawdown lands mid-roadmap.
Tool Plays
Observation — Vora (1,382,204 visits), Arcads (609,185), PostSyncer (327,821), and Framia’s 3.12x MoM surge illustrate the live spectrum from entrenched Sora enhancers to SEO-native challengers. Vora still leans on 63.89% search with 16.2% of traffic from the US, Arcads remains the direct-led AI actor ad platform with 26.2% US share, PostSyncer pairs scheduling with viral video generation yet relies on 49.45% search, and Framia is 100% search-driven.
Analysis — Vora markets itself as Sora without limits, Arcads converts text into AI actor ads, PostSyncer offers AI-assisted scheduling plus viral video tooling for unlimited teams, and Vidguru bundles AI video, image, and audio creation into one subscription, so differentiation lives in workflow packaging rather than acquisition innovation. Arcads’ direct-led approach signals enterprise-grade onboarding, whereas Vora’s search dominance keeps it at the creator top-of-funnel; Framia’s spike without channel diversification highlights the high-beta end of the market, one algorithm change away from obscurity.
Decision impact — Teams integrating with Vora should negotiate co-marketing or embedded placements to harvest its reach even as growth cools, Arcads partners need onboarding and SLAs that match its enterprise motion, PostSyncer buyers should include contingency clauses after its 77% retreat, and Framia collaborators must secure data-sharing plus diversification triggers before scaling licenses; Vidguru and similar suites should be evaluated on their ability to convert US-heavy, search-dependent funnels into vertical packages before procurement treats them as interchangeable utilities.
Rankings (Data Appendix)
Snapshot: current month; tools in category: 33. MoM Growth is a growth ratio (e.g., 0.147 = 14.7%). Shares are proportions (e.g., 0.211 = 21.1%).
Visual Summary
Top tools by current monthly visits, sourced from insight evidence.
Mom Growth for tools with reported growth.
Top 10 tools by Monthly Visits
Vora
Visits: 1,382,204
MoM: -24.5%
Search: 63.89%
Direct: 29.56%
Top Region: United States (16.19%)
Arcads
Visits: 609,185
MoM: -7.7%
Search: 39.86%
Direct: 46.60%
Top Region: United States (26.23%)
PostSyncer
Visits: 327,821
MoM: -77.1%
Search: 49.45%
Direct: 24.21%
Top Region: United States (24.59%)
Tagshop AI
Visits: 174,924
MoM: +24.6%
Search: 52.33%
Direct: 35.18%
Top Region: India (12.37%)
Viral Ecom Adz
Visits: 53,881
MoM: +11.7%
Search: 42.94%
Direct: 36.53%
Top Region: Sweden (26.38%)
Vidguru - All-in-One AI Video & Image Maker
Visits: 42,716
MoM: +73.0%
Search: 41.47%
Direct: 35.36%
Top Region: United States (32.13%)
UGC Ads AI
Visits: 29,729
MoM: +7.2%
Search: 42.92%
Direct: 38.20%
Top Region: Nigeria (11.62%)
Framia
Visits: 28,555
MoM: +312.1%
Search: 100.00%
Direct: 0.00%
Top Region: United States (92.38%)
CloneViral
Visits: 22,868
MoM: +143.8%
Search: 58.19%
Direct: 11.75%
Top Region: United States (38.66%)
Airpost
Visits: 16,759
MoM: +413.9%
Search: 28.97%
Direct: 44.27%
Top Region: United States (49.31%)
MoM Growth leaders (within top 21 by Monthly Visits)
EzUGC
Visits: 14,739
MoM: +440.1%
Search: 22.35%
Direct: 37.89%
Airpost
Visits: 16,759
MoM: +413.9%
Search: 28.97%
Direct: 44.27%
Framia
Visits: 28,555
MoM: +312.1%
Search: 100.00%
Direct: 0.00%
KOOX AI
Visits: 12,418
MoM: +303.8%
Search: 41.58%
Direct: 37.46%
CloneViral
Visits: 22,868
MoM: +143.8%
Search: 58.19%
Direct: 11.75%
Vidguru - All-in-One AI Video & Image Maker
Visits: 42,716
MoM: +73.0%
Search: 41.47%
Direct: 35.36%
TemVideo - AI Viral Product Video Maker
Visits: 1,686
MoM: +67.4%
Search: 0.00%
Direct: 100.00%
Hooked
Visits: 7,202
MoM: +27.5%
Search: 46.26%
Direct: 35.67%
Tagshop AI
Visits: 174,924
MoM: +24.6%
Search: 52.33%
Direct: 35.18%
Product Link To Video Maker
Visits: 3,473
MoM: +20.2%
Search: 16.13%
Direct: 15.64%
Top 3 (by Monthly Visits): Channel Mix
Vora
Visits: 1,382,204
Search: 63.89%
Direct: 29.56%
Referrals: 4.46%
Social: 1.48%
Display: 0.54%
Mail: 0.07%
Arcads
Visits: 609,185
Search: 39.86%
Direct: 46.60%
Referrals: 5.80%
Social: 6.82%
Display: 0.81%
Mail: 0.12%
PostSyncer
Visits: 327,821
Search: 49.45%
Direct: 24.21%
Referrals: 4.73%
Social: 18.88%
Display: 2.61%
Mail: 0.11%
Note: '—' means missing/zeroed in the input dataset.