Three tools already capture 85.2% of measured visits, leaving the|Ad Copy Tools

Executive Summary
Three tools already capture 85.2% of measured visits, leaving the other eleven to split a thin remainder.
Direct traffic accounts for 54.3% of demand versus 33.6% from search, so SEO-led acquisition trails buyer reality by 20.7 points.
Atria’s 61.3% direct share doubles the traffic-weighted norm of 30.5%, underscoring how workflow lock-in now outweighs discoverability.
The median tool receives only 689.5 visits while the average sits at 41,275, showing how a few outliers distort the perceived scale of the category.
Seven of fourteen tools show zero measured visits, meaning half the catalog lacks any observable audience.
Marpipe.com is the single scale challenger pairing 89,549 visits with 15.1% MoM growth, giving it the only clear momentum in an otherwise stagnant market.
Freeadcopy.com still ranks fifth with 20,129 visits despite a -23.1% MoM slide, signaling that prompt-box visibility no longer prevents churn.
Atria’s traffic is only 33.4% U.S. even though 61.3% arrives direct, pointing to globally distributed workflow attachment rather than a single-region niche.
Three Leaders Already Capture 85.2% Of Demand
Atria logs 387,127 visits while marpipe.com and Blobr trail at 89,549 and 53,831, so the top three already absorb 85.2% of measured demand and reduce every other tool to marginal share. That concentration shows this segment behaves like a workflow-suite oligopoly, not a fragmented prompt marketplace. Founders and investors should treat the remaining share as a defensive moat around entrenched creative-ops pipelines rather than a greenfield opportunity.
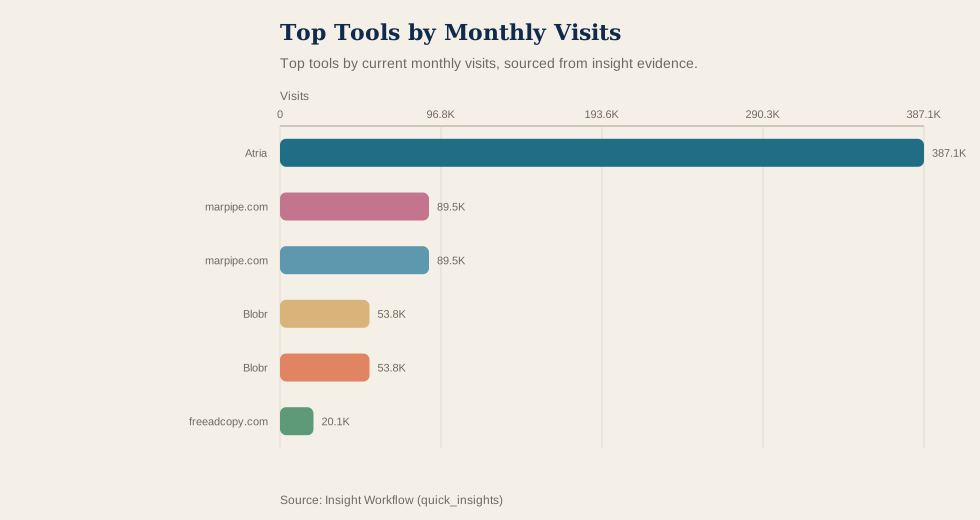
Top tools by current monthly visits, sourced from insight evidence.
Because the average of 41,275 visits is inflated by those outliers, anyone planning against “category averages” is leaning on a benchmark most mid-pack players never reach. Strategy should be anchored to the specific leader a team hopes to displace, not a mathematical mean that masks the long tail.
The leaders already resemble full workflow suites—Atria spans AI ad creation plus reporting, marpipe.com manages dynamic product ads, and Blobr automates Google Ads optimization—which explains why they accumulate direct demand while thin utilities fade. Challengers must match that workflow depth or stay stuck beneath the incumbents’ spend cycles.
Direct-Heavy Buying Habits Reward Workflow Moats
Channel data shows direct traffic at 54.3% versus 33.6% from search, a 20.7-point gap that proves buyers are navigating straight to their chosen workflow tools. Acquisition programs built solely on SEO will lag because decision-makers are relying on saved logins, integrations, and team workflows rather than discovery queries. Product teams should therefore design onboarding around embedding into ad accounts or creative review stacks.
Atria is the clearest signal: 61.3% of its traffic is direct, double the traffic-weighted category average of 30.5%, showing that enterprise teams treat it as the control plane for multi-channel ad ops. That dependence implies stronger pricing power and lower churn, while peers need to replicate approval loops, asset libraries, and performance feedback just to compete.
When direct preference dominates, APIs for Google Ads Editor sync, Meta Creative Hub, or PMAX asset feeds turn into table stakes, because they keep teams operating inside the workflow instead of bouncing out to search. Lagging tools must shift roadmaps from prompt UIs toward automation hooks that justify repeat visits, reinforcing that “Ad Copy Tools” now describes workflow orchestration software.
Half The Catalog Is Invisible, Validating Prompt-Box Decay
Seven of fourteen tools—Ecomadpro, CopyFlow Pro, CopyCop, AdCopy, PixCanva, Adinspiration, and AdCopy.ai—report zero measured visits, turning half the category into a ghost tier. Generic copy widgets are no longer winning measurable demand even when they remain online. Founders should retire or drastically reposition those clones instead of waiting for marketing to revive them.
The median tool sees 689.5 visits while the average is 41,275, meaning most products operate two orders of magnitude below headline numbers. Investors need to inspect the actual visit curve before underwriting growth narratives, and developers should accept that copy-only differentiation rarely clears the awareness bar.
Combining the zero-traffic cohort with the depressed median confirms commoditization: undifferentiated utilities are starved of discovery and repeat use. The actionable path is to bundle creative review, variant testing, or campaign handoff into the product so acquisition can lean on embedded value rather than rank-chasing.
Growth Divergence Elevates Marpipe While Freeadcopy Slides
Marpipe.com is the only tool above 50,000 visits still expanding, posting 15.1% MoM growth on top of 89,549 visits. That momentum suggests brands with large catalogs still want creative testing workflows tuned for dynamic product ads, giving marpipe.com a narrative beyond generic copywriting. Developers looking for a wedge should examine DPA- and catalog-first integrations, while investors can treat marpipe.com as the lone challenger with both scale and acceleration worth diligence.
Freeadcopy.com shrank 23.1% MoM yet clings to fifth place with 20,129 visits, illustrating how prompt-box visibility erodes once users migrate to workflow-rich competitors. Freemium GPT wrappers must either add testing loops quickly or expect further share loss as sophisticated buyers chase structured exports like RSA or PMAX sets.
The dataset only provides traffic levels and MoM deltas for these two players, so the moves should be read as directional signals rather than fully explained trends. Even so, the contrast aligns with the channel story: marpipe.com’s workflow narrative matches direct-led buying, while freeadcopy.com’s decline mirrors one-off prompt fatigue. The next marker to watch is whether marpipe.com can convert its growth into a higher direct share, which would confirm entry into the leaders’ habitual-use corridor.
Atria's Distributed Demand Signals Enterprise Pull
Atria draws only 33.4% of its traffic from the United States even as 61.3% of demand comes direct, showing that habitual users span multiple regions instead of clustering in one domestic niche. The platform already functions as a global creative-ops control center, and rivals will need multilingual asset governance plus distributed approval chains to match that breadth.
With 387,127 visits against marpipe.com’s 89,549 and Blobr’s 53,831, Atria enjoys more than a fourfold traffic advantage over every challenger. Its AI ad platform narrative covers generation, inspiration, reporting, and analytics, matching the repeatable workflows buyers reward. That scale plus direct reliance sets expectations for multi-seat pricing and upsell depth, while founders should assume enterprise buyers will compare them directly to Atria’s feature map.
Regional diversification plus direct dominance suggests Atria has penetrated multi-market service providers that require brand governance, approval workflows, and cross-channel asset libraries. That inference reinforces why direct share is the clearest signal of defensibility in this category and why API-first exports for Google responsive search ads, PMAX asset bundles, and shared libraries now feel mandatory for evaluation cycles.
Rankings (Data Appendix)
Snapshot: current month; tools in category: 14. MoM Growth is a growth ratio (e.g., 0.147 = 14.7%). Shares are proportions (e.g., 0.211 = 21.1%).
Visual Summary
Top tools by current monthly visits, sourced from insight evidence.
Top 9 tools by Monthly Visits
Atria
Visits: 387,127
MoM: +12.3%
Search: 29.52%
Direct: 61.27%
Top Region: United States (33.38%)
marpipe.com
Visits: 89,549
MoM: +15.1%
Search: 41.56%
Direct: 38.83%
Top Region: United States (17.59%)
Blobr
Visits: 53,831
MoM: +9.8%
Search: 50.21%
Direct: 35.59%
Top Region: United States (15.38%)
30characters
Visits: 21,754
MoM: +2.4%
Search: 29.53%
Direct: 48.55%
Top Region: United States (23.79%)
freeadcopy.com
Visits: 20,129
MoM: -23.1%
Search: 34.44%
Direct: 49.77%
Top Region: United States (43.68%)
Google SERP Simulator
Visits: 3,785
MoM: +0.3%
Search: 44.98%
Direct: 38.51%
Top Region: Australia (35.81%)
Adbot - Your Search Ads Specialist
Visits: 878
MoM: -62.9%
Search: 39.23%
Direct: 38.33%
Top Region: Brazil (38.75%)
AdCopy.ai
Visits: 501
MoM: 0.0%
Search: 42.37%
Direct: 36.48%
Top Region: Brazil (100.00%)
Adinspiration
Visits: 297
MoM: 0.0%
Search: 50.35%
Direct: 30.07%
Top Region: Honduras (100.00%)
MoM Growth leaders (within top 9 by Monthly Visits)
marpipe.com
Visits: 89,549
MoM: +15.1%
Search: 41.56%
Direct: 38.83%
Atria
Visits: 387,127
MoM: +12.3%
Search: 29.52%
Direct: 61.27%
Blobr
Visits: 53,831
MoM: +9.8%
Search: 50.21%
Direct: 35.59%
30characters
Visits: 21,754
MoM: +2.4%
Search: 29.53%
Direct: 48.55%
Google SERP Simulator
Visits: 3,785
MoM: +0.3%
Search: 44.98%
Direct: 38.51%
AdCopy.ai
Visits: 501
MoM: 0.0%
Search: 42.37%
Direct: 36.48%
Adinspiration
Visits: 297
MoM: 0.0%
Search: 50.35%
Direct: 30.07%
freeadcopy.com
Visits: 20,129
MoM: -23.1%
Search: 34.44%
Direct: 49.77%
Adbot - Your Search Ads Specialist
Visits: 878
MoM: -62.9%
Search: 39.23%
Direct: 38.33%
Top 3 (by Monthly Visits): Channel Mix
Atria
Visits: 387,127
Search: 29.52%
Direct: 61.27%
Referrals: 5.89%
Social: 2.56%
Display: 0.63%
Mail: 0.11%
marpipe.com
Visits: 89,549
Search: 41.56%
Direct: 38.83%
Referrals: 11.83%
Social: 6.59%
Display: 1.05%
Mail: 0.15%
Blobr
Visits: 53,831
Search: 50.21%
Direct: 35.59%
Referrals: 8.78%
Social: 4.29%
Display: 1.02%
Mail: 0.11%
Note: “—” indicates missing or zero values in the dataset.