Adobe Podcast draws 8.86M monthly visits, 18.8x the 471k category|AI Audio Enhancer

Executive Summary
Adobe Podcast draws 8.86M monthly visits, 18.8x the 471k category average, so buyers should act as though a single incumbent controls demand until another tool proves comparable pull.
Fifty-five percent of listed tools report zero visits, so catalog depth is mostly cosmetic and diligence needs to confirm traffic before any partnership pitch.
Direct channels account for 55.91% of category traffic versus 37.29% from search, giving brands with existing recall a structural edge over SEO-dependent challengers.
Spectrahertz gets 74.1% of its traffic from search and just showed a 24.36x MoM spike, illustrating how headline growth can hinge on algorithm swings rather than owned demand.
AudioX sources 13.42% of visits from referrals, almost triple the category norm, while direct sits at 34.46%, leaving it exposed to partner decisions.
Audio Enhancer still logs 169,008 visits yet posted a -0.135 MoM factor, signaling saturation that forces scaled operators to show upsell leverage before chasing fresh capital.
Xound.io draws 50.24% of visits from India versus 7.83% from the United States, proving geo specialization potential while reminding North American buyers the product remains niche locally.
Keyword instrumentation remains blank for both the category and Adobe Podcast, so SEO planning should pause until tracking resumes or teams risk guessing channel economics.
Monopoly Scale Masks Depth
Adobe Podcast, the company’s AI-driven audio recording and editing platform, captures 8.86M monthly visits while the category average sits at 471k and the median tool shows none. The result feels like a monopoly: whenever creators research enhancement workflows, Adobe already has default mindshare. Decision impact: founders and investors should assume buyers start with an Adobe-plus-one shortlist and only pitch wedges the incumbent cannot defend, such as data-specific or compliance-heavy workflows. Developers scoping partner APIs should plan to piggyback on Adobe’s distribution if they need near-term reach.
More than half of the catalog records zero visits, with only 9 of 20 tools showing any traffic at all. Vendor variety is largely a mirage, so BD teams risk chasing inactive projects that cannot clear basic integration readiness. Decision impact: buyers and channel partners should demand live traffic evidence before scheduling evaluations, concentrating the funnel on the handful of active operators. Enterprise BD teams likewise need proof-of-life metrics before offering sandbox access or co-marketing slots.
The visible traffic stack stays top-heavy, with Adobe Podcast at 8.86M visits against the 471k peer average, meaning challengers are really fighting Creative Cloud’s go-to-market muscle rather than one another. Decision impact: procurement leads should prepare contingency suppliers only for edge cases while expecting Adobe to serve mainstream enhancement needs.
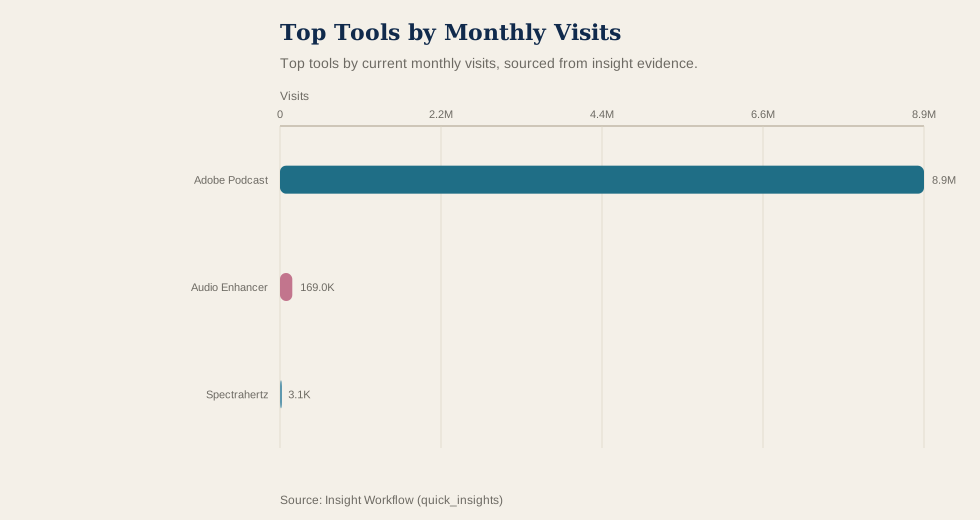
Top tools by current monthly visits, sourced from insight evidence.
Concentrated traffic lets the incumbent dictate ecosystem pricing and roadmap timing long before negotiations start. Operator takeaway: track non-Adobe share monthly so resources can pivot the moment another tool shows durable volume.
Direct Channels Set the Moat
Category acquisition already leans 55.91% direct versus 37.29% search and 4.71% referrals, proving owned audiences underpin durable growth. Developers launching new AI audio workflows should budget for lifecycle loops, content syndication, and customer success rather than expecting SEO to carry the load. Decision impact: investors assessing go-to-market readiness should benchmark direct share before funding performance-heavy plans to avoid subsidizing inefficient channels. For developers, that means investing time in community drops, tutorial content, and workflow templates before touching paid acquisition.
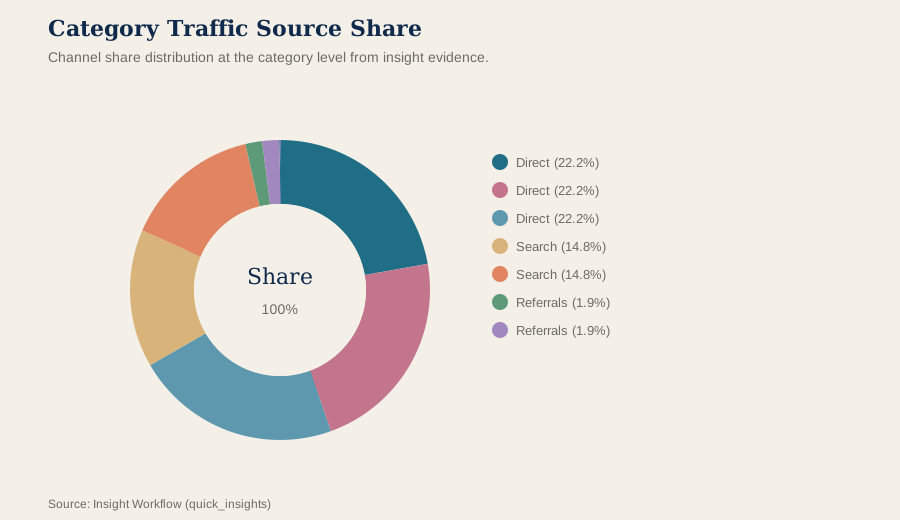
Channel share distribution at the category level from insight evidence.
Direct dominance means whoever controls brand recall can reset switching costs overnight. Operator takeaway: if your direct share trails the benchmark, divert roadmap points toward community programs or bundled distribution before scaling paid spend.
Spectrahertz shows the downside of ignoring that mix: 74.1% of its traffic comes from search while direct covers just 16.44%. That dependence leaves the team hostage to algorithm shifts because a single ranking change can wipe visibility before a product update ships. Decision impact: PMs should redirect resources toward email capture, community spaces, or lightweight APIs before another search update crashes the funnel. Without that shift, engineers end up patching SEO tactics instead of shipping differentiated enhancement features.
AudioX, an AI audio generation tool spanning text-to-music workflows, leans on referrals for 13.42% of visits versus the 4.71% category baseline while direct lags at 34.46%. The pipeline is contingent on partner hubs or affiliate catalogs, so one upstream policy tweak can slash conversions without warning. Decision impact: investors should price referral-heavy plays as channel arbitrage and require explicit timelines for building owned nurture paths before scaling spend. Founders pursuing this route must treat every partner as a quasi-customer success motion with enablement and retention scorecards.
Volatility Masks Denominator Risk
Spectrahertz’s 24.36x MoM surge rests on only 3,145 visits, so the ratio reflects a tiny denominator rather than sticky adoption. The pattern usually signals experimental spend that disappears once campaigns pause. Decision impact: developers and founders should pair every celebratory ratio with absolute visit gates and stop-loss triggers so resources shut off as soon as uplift fades. Investors should treat these spikes as marketing tests, not valuation anchors.
Audio Enhancer brings in 169,008 visits yet prints a -0.1353 MoM factor, confirming that scaled AI audio enhancers are already in saturation mode. Incremental marketing now defends a plateau, so enterprise buyers should expect slower feature delivery as teams focus on retention and support efficiency. Decision impact: investors must insist on monetization or workflow-expansion narratives instead of assuming the existing audience will grow without added spend. Product leaders need governance that keeps reliability and retention ahead of speculative growth stunts.
The gulf between Spectrahertz’s +24.36x and Audio Enhancer’s -0.1353 shows how the same metric tells opposite stories depending on base volume. Category averages blur nascent experiments with mature incumbents. Decision impact: PMs should segment roadmaps by lifecycle stage, funding experimentation for low-base tools and operational hardening for scaled ones. Analysts benchmarking the space should classify tools by stage before comparing ratios to avoid false equivalence.
Region Skews Reshape Go-To-Market
Xound.io concentrates 50.24% of its traffic in India while the United States contributes only 7.83%, revealing a single-region dependency. The AI sound enhancement pitch currently fits Indian creator workflows more than U.S. enterprise audio stacks, so packaging and compliance likely need localization before a North American push. Decision impact: product leaders should treat India as the control market while funding U.S. efforts as greenfield experiments with separate success criteria. Developers should expect feedback to lean heavily on India-specific constraints until a second region scales.
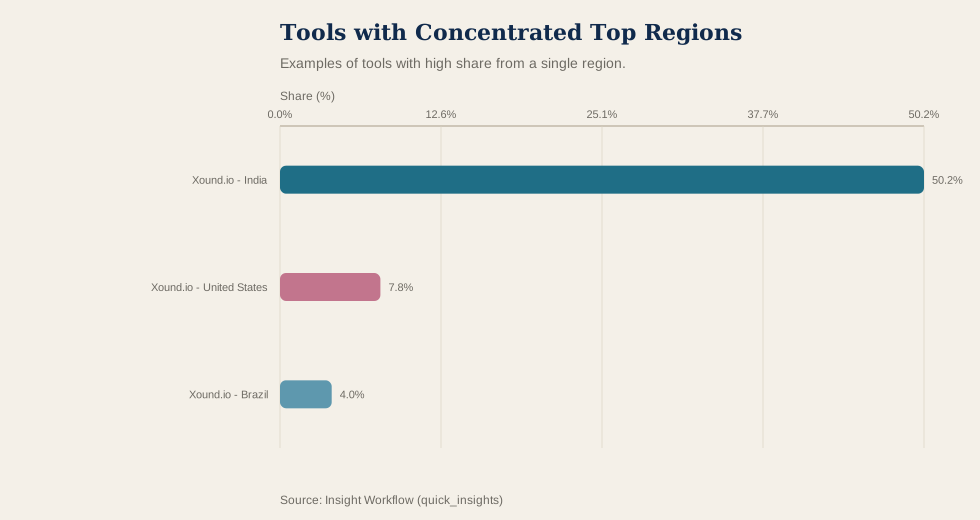
Examples of tools with high share from a single region.
Regionally concentrated demand amplifies exposure to payment rails, currency moves, and policy shocks in that market. Operator takeaway: build a second acquisition engine before rerouting infrastructure or pricing.
Because India supplies more than six times the U.S. share, revenue models must reflect local ARPU realities instead of assuming parity with North American SaaS buyers. The numbers warn investors that valuations pegged to U.S.-style pricing will overshoot unless the company proves payment optionality and enterprise support in that market. Decision impact: CFOs and PMs should sync geo-expansion with features that address U.S. procurement hurdles rather than porting the India playbook. Leadership teams also need KPIs aligned to Indian payment cycles and buyer expectations before expecting predictable cash conversion.
Brazil captures only 4.03% of Xound.io traffic compared with India’s 50.24%, so Latin America remains a tertiary corridor. Organic spillover is unlikely, meaning developers counting on word-of-mouth must plan for localized partnerships, language support, and pricing experiments. Decision impact: go-to-market teams should secure reseller pilots or creator collective alliances before forecasting Latin American revenue, and investors should treat that exposure as a long-dated option rather than a near-term lever.
Instrumentation Limits Constrain Search Strategy
Keyword tracking fields remain blank for both the AI Audio Enhancer market and Adobe Podcast, leaving SEO strategists without query-level evidence to guide bids or content. Channel managers cannot tell whether traffic is branded, category, or experimental, so every optimization becomes a guess. Decision impact: teams should freeze major SEO budget shifts and prioritize restoring telemetry or running proxy studies before drawing conclusions. PMs should assume any search insight in data rooms is anecdotal until instrumentation returns.
Search-dependent players like Spectrahertz, already sourcing 74.1% of visits from search, face amplified danger because they cannot pinpoint which queries convert. Without keyword logs, developers may waste cycles on landing-page tweaks that solve nothing if Google’s mix shifts. Decision impact: investors should discount valuations for any vendor that cannot furnish keyword evidence, pricing them as unproven acquisition experiments. Engineering leaders should prioritize analytics plumbing ahead of incremental keyword-targeted pages until the data gap closes.
Even the category-level 37.29% search share becomes hard to interpret without keyword depth because no one can separate defensive brand capture from net-new discovery. This constraint pushes PMs toward interviews or test-market pilots to understand intent, slowing roadmap prioritization until measurement catches up. Decision impact: enterprise buyers should request alternative attribution exports—analytics logs, CRM tags, or cohort notes—before assuming a vendor can sustain search-driven integrations. Until that happens, treat SEO claims as narratives rather than contractual assurances.
Rankings (Data Appendix)
Snapshot: current monthly visits; tools in category: 20. MoM Growth is a growth ratio (e.g., 0.147 = 14.7%). Shares are proportions (e.g., 0.211 = 21.1%).
Visual Summary
Top tools by current monthly visits, sourced from insight evidence.
Channel share distribution at the category level from insight evidence.
Top 9 tools by Monthly Visits
Adobe Podcast
Visits: 8,861,482
MoM: -0.4%
Search: 36.41%
Direct: 57.22%
Top Region: United States (13.83%)
Audio AI Dynamics
Visits: 185,019
MoM: +11.6%
Search: 51.42%
Direct: 35.38%
Top Region: Russia (11.09%)
Audio Enhancer
Visits: 169,008
MoM: -13.5%
Search: 56.77%
Direct: 32.36%
Top Region: India (10.00%)
Xound.io
Visits: 78,297
MoM: +19.7%
Search: 49.57%
Direct: 37.14%
Top Region: India (50.24%)
AudioX
Visits: 64,450
MoM: -12.7%
Search: 44.84%
Direct: 34.46%
Top Region: United States (11.26%)
noteperformer.com
Visits: 53,646
MoM: +13.1%
Search: 45.00%
Direct: 40.76%
Top Region: United States (33.34%)
CrystalSound
Visits: 8,875
MoM: +57.1%
Search: 34.08%
Direct: 51.08%
Top Region: United States (27.02%)
Spectrahertz
Visits: 3,145
MoM: +2436.3%
Search: 74.10%
Direct: 16.44%
Top Region: United States (53.23%)
Shanda Studio
Visits: 2,040
MoM: +5.6%
Search: 17.30%
Direct: 68.47%
Top Region: United States (63.08%)
MoM Growth leaders (within top 9 by Monthly Visits)
Spectrahertz
Visits: 3,145
MoM: +2436.3%
Search: 74.10%
Direct: 16.44%
CrystalSound
Visits: 8,875
MoM: +57.1%
Search: 34.08%
Direct: 51.08%
Xound.io
Visits: 78,297
MoM: +19.7%
Search: 49.57%
Direct: 37.14%
noteperformer.com
Visits: 53,646
MoM: +13.1%
Search: 45.00%
Direct: 40.76%
Audio AI Dynamics
Visits: 185,019
MoM: +11.6%
Search: 51.42%
Direct: 35.38%
Shanda Studio
Visits: 2,040
MoM: +5.6%
Search: 17.30%
Direct: 68.47%
Adobe Podcast
Visits: 8,861,482
MoM: -0.4%
Search: 36.41%
Direct: 57.22%
AudioX
Visits: 64,450
MoM: -12.7%
Search: 44.84%
Direct: 34.46%
Audio Enhancer
Visits: 169,008
MoM: -13.5%
Search: 56.77%
Direct: 32.36%
Top 3 (by Monthly Visits): Channel Mix
Adobe Podcast
Visits: 8,861,482
Search: 36.41%
Direct: 57.22%
Referrals: 4.52%
Social: 1.66%
Display: 0.17%
Mail: 0.03%
Audio AI Dynamics
Visits: 185,019
Search: 51.42%
Direct: 35.38%
Referrals: 6.65%
Social: 5.70%
Display: 0.74%
Mail: 0.10%
Audio Enhancer
Visits: 169,008
Search: 56.77%
Direct: 32.36%
Referrals: 7.21%
Social: 2.59%
Display: 0.94%
Mail: 0.12%
Note: "--" means missing or zeroed values in the input dataset.