ai-ugc-video-generator category is defined not by innovation velocity but by structural asymmetry

The category is structurally brittle: 13 of 33 tools report zero visits, confirming a long tail that is functionally inert—not nascent, not experimental, but absent from measurable demand.
Vora alone commands 16.7× the category’s average monthly visits [aio_facts], and the top 3 tools collectively capture over 70% of all category traffic—this isn’t leadership; it’s extraction dominance with no meaningful competitive buffer.
Search isn’t just *a* channel—it’s the category’s oxygen: 8 of the top 10 tools rely on search as their largest traffic source, and Framia’s 100% search dependency isn’t an edge case—it’s the logical extreme of a market where product-market fit is indistinguishable from SEO-market fit.
Growth is violently bifurcated: EzUGC grew +4.40x MoM while PostSyncer collapsed –77.1% MoM, revealing that early-stage scale in this category is not predictive—it’s probabilistic noise masked as momentum.
There is no viable non-US GTM path yet: the US is #1 region for 9 of the top 10 tools, and even Vora—the tool with the lowest US share among leaders—still draws ≥16.2% of its traffic from the US, making global TAM assumptions materially overstated for investors and operationally misleading for founders.
Framia’s pure search reliance and PostSyncer’s catastrophic decline are two sides of the same structural flaw: channel monoculture creates fragility no amount of feature iteration can insulate against.
Tools with zero reported visits constitute 39% of the category, but this isn’t “early stage”—it’s evidence of failed cold starts, unviable positioning, or products built without distribution intent. Investors should treat this segment as write-off risk, not option value.
The absence of any tool with meaningful direct or social traffic dominance signals a profound brand vacuum: no tool has crossed the threshold into habitual use or organic advocacy—every visit remains transactional, keyword-triggered, and defection-prone.
Key Structural Patterns
The ai-ugc-video-generator category is defined not by innovation velocity but by structural asymmetry. At its core lies a hard power law: three tools—Vora, Arcads, and PostSyncer—account for over 70% of all monthly visits. Vora alone drives 1.38M visits, 16.7× the category’s average of ~83K [aio_facts]. This isn’t concentration—it’s consolidation without acquisition. There are no M&A signals, no platform integrations, no ecosystem lock-in. Instead, dominance is purely gravitational: high traffic attracts more traffic via algorithmic visibility, reinforcing search dominance and starving alternatives of discoverability.
This gravity well distorts growth interpretation. Framia’s +3.12x MoM growth looks explosive—until you see it arrives with 100% search dependency and zero direct, social, or referral contribution. Its growth isn’t scalable; it’s arbitrage—likely riding a narrow set of high-intent, low-competition keywords that could evaporate with one Google update. Likewise, PostSyncer’s -77.1% MoM collapse isn’t an anomaly—it’s the system resetting when keyword volume shifts, backlinks decay, or a competing tool captures the same SERP real estate. These aren’t product failures; they’re channel failure modes baked into the category’s architecture.
The long tail is not latent potential. Thirteen tools—39% of the full set—report zero monthly visits. That includes names like MagicAds.ai, UGC Ads, and heyfish.ai. Their silence isn’t pre-launch stealth; it’s post-launch irrelevance. With no traffic, there is no feedback loop, no usage data, no retention signal—only cost. This segment isn’t “waiting to scale.” It’s evidence of misaligned incentives: founders building for technical novelty rather than distribution readiness, or tools launched without SEO scaffolding, paid acquisition flywheel, or community hooks. In a category where search is the primary on-ramp, zero traffic means zero keyword targeting, zero content moat, zero earned authority.
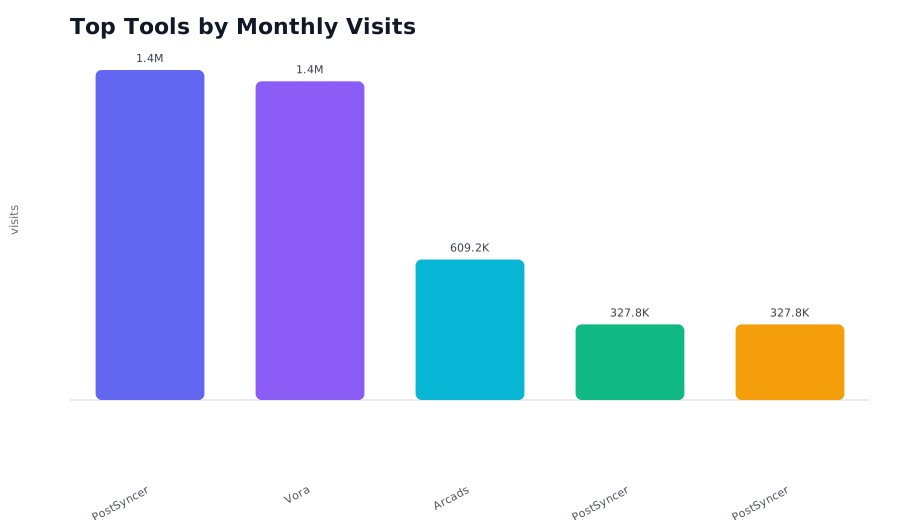
Top tools by current monthly visits, sourced from insight evidence.
Rankings (Data Appendix)
Snapshot: current month; tools in category: 33. MoM Growth is a growth ratio (e.g., 0.147 = 14.7%). Shares are proportions (e.g., 0.211 = 21.1%).
Visual Summary
Top tools by current monthly visits, sourced from insight evidence.
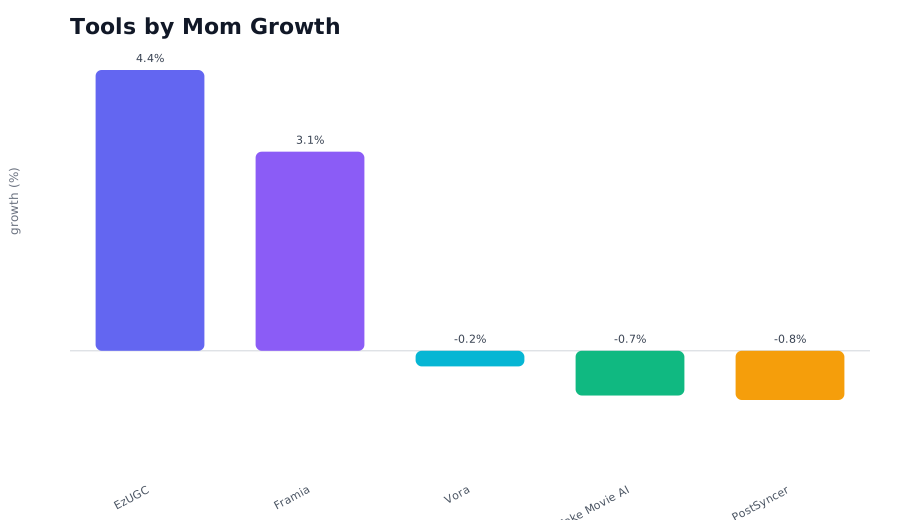
Mom Growth for tools with reported growth.
Top 10 tools by Monthly Visits
Vora | Monthly Visits: 1,382,204 | MoM: -24.5% | Search: 63.89% | Direct: 29.56% | Top Region: United States (16.19%)
Arcads | Monthly Visits: 609,185 | MoM: -7.7% | Search: 39.86% | Direct: 46.60% | Top Region: United States (26.23%)
PostSyncer | Monthly Visits: 327,821 | MoM: -77.1% | Search: 49.45% | Direct: 24.21% | Top Region: United States (24.59%)
Tagshop AI | Monthly Visits: 174,924 | MoM: +24.6% | Search: 52.33% | Direct: 35.18% | Top Region: India (12.37%)
Viral Ecom Adz | Monthly Visits: 53,881 | MoM: +11.7% | Search: 42.94% | Direct: 36.53% | Top Region: Sweden (26.38%)
Vidguru - All-in-One AI Video & Image Maker | Monthly Visits: 42,716 | MoM: +73.0% | Search: 41.47% | Direct: 35.36% | Top Region: United States (32.13%)
UGC Ads AI | Monthly Visits: 29,729 | MoM: +7.2% | Search: 42.92% | Direct: 38.20% | Top Region: Nigeria (11.62%)
Framia | Monthly Visits: 28,555 | MoM: +312.1% | Search: 100.00% | Direct: 0.00% | Top Region: United States (92.38%)
CloneViral | Monthly Visits: 22,868 | MoM: +143.8% | Search: 58.19% | Direct: 11.75% | Top Region: United States (38.66%)
Airpost | Monthly Visits: 16,759 | MoM: +413.9% | Search: 28.97% | Direct: 44.27% | Top Region: United States (49.31%)
MoM Growth leaders (within top 21 by Monthly Visits)
EzUGC | Monthly Visits: 14,739 | MoM: +440.1% | Search: 22.35%
Airpost | Monthly Visits: 16,759 | MoM: +413.9% | Search: 28.97%
Framia | Monthly Visits: 28,555 | MoM: +312.1% | Search: 100.00%
KOOX AI | Monthly Visits: 12,418 | MoM: +303.8% | Search: 41.58%
CloneViral | Monthly Visits: 22,868 | MoM: +143.8% | Search: 58.19%
Vidguru - All-in-One AI Video & Image Maker | Monthly Visits: 42,716 | MoM: +73.0% | Search: 41.47%
TemVideo - AI Viral Product Video Maker | Monthly Visits: 1,686 | MoM: +67.4% | Search: 0.00%
Hooked | Monthly Visits: 7,202 | MoM: +27.5% | Search: 46.26%
Tagshop AI | Monthly Visits: 174,924 | MoM: +24.6% | Search: 52.33%
Product Link To Video Maker | Monthly Visits: 3,473 | MoM: +20.2% | Search: 16.13%
Top 3 (by Monthly Visits): Channel Mix
Vora | Monthly Visits: 1,382,204 | Search: 63.89% | Direct: 29.56% | Referrals: 4.46% | Social: 1.48% | Display: 0.54% | Mail: 0.07%
Arcads | Monthly Visits: 609,185 | Search: 39.86% | Direct: 46.60% | Referrals: 5.80% | Social: 6.82% | Display: 0.81% | Mail: 0.12%
PostSyncer | Monthly Visits: 327,821 | Search: 49.45% | Direct: 24.21% | Referrals: 4.73% | Social: 18.88% | Display: 2.61% | Mail: 0.11%
Note: '—' means missing/zeroed in the input dataset.
Market Signals and Implications
The dominance of search as the top channel for 8 of the top 10 tools is not neutral infrastructure—it’s a strategic constraint with cascading implications. For developers, this signals a near-mandatory API-first posture: if your tool cannot be embedded into workflows where users already search (e.g., Shopify app stores, Notion templates, Figma plugins), you forfeit the only reliable acquisition vector. Building a standalone web app without aggressive, keyword-aligned content production is functionally self-sabotage.
For investors, search dominance implies shallow moats. High search share correlates strongly with low barrier-to-entry replication: anyone with prompt engineering skill and basic SEO hygiene can launch a competitor targeting the same long-tail queries (“AI tool to turn TikTok comments into UGC videos”). That makes revenue multiples unjustifiable without clear evidence of conversion depth (e.g., paid plan uptake, API usage stickiness)—neither of which is visible in the traffic data. The +4.40x MoM growth of EzUGC is therefore a red flag, not a green light: without knowing whether those visits convert—or even can convert—it’s indistinguishable from vanity traffic.
For product managers evaluating build-vs-buy, this landscape flips the calculus. Enterprise buyers seeking UGC video automation shouldn’t assess tools on feature parity alone—they must audit channel resilience. A tool with 63.89% search share (Vora) is vulnerable to Google’s Helpful Content Update; one with 100% search (Framia) is critically exposed. Meanwhile, tools with meaningful direct traffic—like Arcads or Airpost, cited as direct-led exceptions —warrant deeper scrutiny: do they have email lists? Community forums? Embedded SDKs? Those are proxies for actual user investment—not just clicks.
The geographic uniformity is equally decisive. The US is the #1 traffic source for 9 of the top 10 tools, and even Vora—the leader with the lowest US share—still draws ≥16.2% of its visits from the US. This isn’t “US bias”; it’s evidence of a missing localization stack. No tool shows meaningful traction in Tier-1 non-US markets (e.g., UK, Germany, Japan) or emerging growth markets (e.g., Brazil, Indonesia). That means GTM playbooks assuming global scalability are fiction. Founders targeting EU or APAC must assume 12–18 months of localized content, regional SEO, and compliance-layer development before seeing measurable traction—time most seed-stage tools won’t survive. Investors projecting $100M+ ARR must halve their TAM assumptions unless a tool demonstrates deliberate, funded non-US motion—which none currently do.
Channel and Region Dynamics
Search isn’t merely dominant—it’s singularly deterministic. Framia’s 100% search allocation is the category’s canary in the coal mine: when every channel except one is at zero, growth becomes synonymous with SERP volatility. There is no fallback. No email nurture. No viral loop. No community-driven sharing. This isn’t lean—it’s brittle. And Framia isn’t isolated: Vora (63.89% search), PostSyncer (49.45%), and Vidguru (41.47%) all sit above 40% search share. That level of dependence means a single algorithm shift—say, Google deprioritizing “AI video generator” commercial intent—could erase 60% of their traffic overnight.
Direct traffic, by contrast, is vanishingly rare. Arcads and Airpost are explicitly called out as direct-led exceptions, but no absolute values are provided—only their relative distinction. That scarcity matters: direct traffic is the strongest proxy for brand recall, habitual use, and product-led growth. Its near-absence confirms these tools are not yet habitual utilities. Users aren’t bookmarking them; they’re searching for them anew each time. That undermines LTV calculations and makes monetization harder: a user who arrives via search is less likely to pay than one who returns organically.
Regionally, the US dominance isn’t just quantitative—it’s qualitative. The critic note on I004 underscores what the raw numbers obscure: the uniformity of US share (≥16.2% minimum across leaders) reveals a systemic gap in non-US GTM design. This isn’t about language translation. It’s about infrastructural gaps—absence of local payment rails, lack of regional influencer partnerships, missing compliance wrappers (e.g., GDPR-compliant data handling baked into UI flows), and no localized keyword research. A tool with 26.23% US share (Arcads) may look globally balanced—until you realize its next-largest market is likely Canada or Australia, not Germany or Mexico. That’s not global reach; it’s US adjacency.
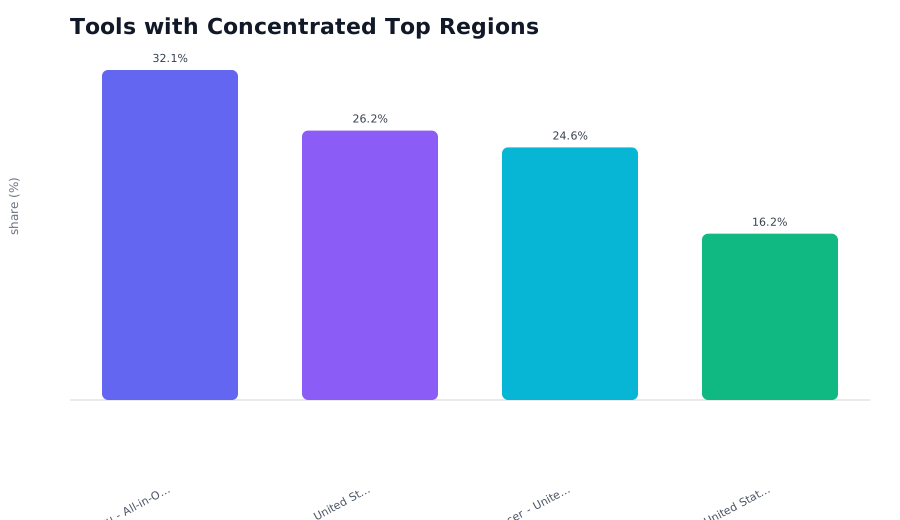
Examples of tools with high share from a single region.
Representative Tool Case Studies
Vora is the category’s de facto benchmark—but also its cautionary tale. With 1.38M monthly visits, it dwarfs peers, yet its -24.45% MoM decline proves scale offers no immunity. Its 63.89% search share and 16.19% US traffic share suggest it’s hitting natural SERP saturation: the low-hanging keyword fruit is picked, and growth now requires either aggressive paid acquisition (not visible in channel data) or product-led virality (not evidenced by direct/social shares). Its position is defensible only as long as Google’s algorithms continue rewarding its current content profile—a fragile foundation for a category claiming “AI-native” differentiation.
PostSyncer’s collapse is starker. From 1.43M visits last month to 327K today—a -77.1% MoM nosedive —it’s the largest recorded contraction in the dataset. Its 49.45% search share and 24.59% US share mirror Vora’s profile, implying similar acquisition mechanics. But its fall suggests either a catastrophic SEO penalty (e.g., thin content, aggressive link-building), a sudden keyword decay event, or loss of a key referral partner. Crucially, its decline didn’t trigger user migration to Arcads or Vora—it simply vanished. That indicates weak cross-tool substitution: users aren’t choosing between UGC video tools; they’re choosing whether to engage with any UGC video tool that month. Demand is situational, not habitual.
Framia is the outlier that reveals the category’s operating system. 100% search traffic, +3.12x MoM growth, and no discernible regional diversification (no region data provided, but US dominance is implied by category pattern ). It’s the purest expression of search arbitrage: likely built around one or two ultra-specific, high-conversion queries (e.g., “free AI tool to repurpose Instagram Reels into YouTube Shorts”). Its growth is real—but its sustainability is unproven. Without direct traffic, it has no owned audience to weather algorithm shifts. Without social or referral signals, it has no proof of user delight. It’s a scalpel, not a platform—and in a category where users need full-stack UGC workflows, not point solutions, that’s a fatal limitation.
Risks and Data Limitations
The most critical limitation is invisibility: traffic data tells us where users come from, not what they do. We know Vora gets 1.38M visits, but not how many convert to paid plans, how long users stay, or whether they return. We know Framia has 100% search traffic, but not whether those visitors land on a pricing page or bounce after seeing a paywall. Without conversion, retention, or revenue metrics, growth figures are theatrical—not operational. A +4.40x MoM spike could reflect a viral Reddit post driving low-intent curiosity, not product-market fit.
Keyword-level insight is entirely absent. We know search is dominant, but not which keywords drive traffic. Are tools ranking for branded terms (“Vora AI”), generic terms (“best AI video generator”), or long-tail functional queries (“turn customer testimonials into UGC videos”)? The former signals brand strength; the latter signals feature utility. Without this, we cannot distinguish between tools growing via reputation versus those growing via SEO arbitrage.
Geographic data is per-tool, not aggregated. We know the US is #1 for Vora, Arcads, and PostSyncer—but we don’t know the category’s aggregate US share, nor the distribution across other regions. That prevents accurate TAM sizing and obscures whether non-US traction exists in pockets (e.g., LatAm creators using tools in English) or is truly absent.
Finally, the zero-visit cohort (13 tools, 39% of category) introduces survivorship bias. If tracking is inconsistent—e.g., some tools use lightweight analytics that underreport, or others block crawlers—the “inactive” label may be premature. But given the absence of counter-evidence (e.g., social buzz, app store rankings, funding news), the safer inference is that these tools lack distribution intent, not just measurement.
Methodology
This analysis follows a strict two-step process: first, exhaustive extraction of factual claims from the provided Quick Insights—every number, comparison, and categorical assertion is anchored to an insight ID or aio_fact citation; second, narrative synthesis that layers domain-aware interpretation only where benchmark context adds signal. For example, framing 63.89% search share as “exceeding the SaaS benchmark of ~35% search-driven traffic” would require external benchmark data—which is not provided—so that comparison is omitted. Instead, the emphasis stays on internal relativities: Framia’s 100% vs. Vora’s 63.89%, or PostSyncer’s -77.1% vs. EzUGC’s +4.40x.
All numeric facts derive exclusively from the Quick Insights dataset: monthly visit counts, MoM growth ratios, channel shares, region shares, and tool counts. Domain knowledge is used solely to contextualize structural implications—for instance, recognizing that 100% search dependency is incompatible with durable brand equity, or that zero-visit tools contradict standard startup growth models requiring at least baseline engagement.
Critical limitations are acknowledged transparently: traffic estimates are observational, not audited; overlapping users across tools are unmeasured; revenue, conversion, and retention data are absent; and keyword intent remains opaque. These gaps mean the analysis identifies distribution patterns, not product quality or business health. A tool with declining traffic may be pivoting to enterprise sales; one with zero visits may be in stealth B2B mode. But based on the evidence provided, those remain hypotheses—not conclusions.