AI Art Generator Market Analysis Report

Executive Summary (Using using-superpowers to confirm required skill compliance.) - Inference — Adobe, Civitai, and PhotoAI capture 64.5M of the category’s 76.1M estimated monthly visits, so just three tools absorb 85% of all demand and define the enterprise, community, and consumer poles of this market. - Inference — Half of the 891 tracked tools record zero estimated visits while the top 10 command 99.9% of traffic, proving the long tail has effectively collapsed for AI Art Generator distribution. - Inference — Direct traffic accounts for 54.2% of category sessions, beating the 40% benchmark by 36% and signaling brand-led access patterns that newcomers must treat as default defensive moats. - Inference — Raphael AI’s +43.5% MoM surge, coupled with simultaneous branded-search (+28%) and GitHub-star (+120%) gains, is the lone growth story showing developer pull instead of paid demand capture. - Inference — Midjourney (-6.4%), SeaArt.AI (-30.1%), 123RF AI (-10.7%), and Depositphotos AI (-6.0%) all contract in the same month, revealing that incumbents across premium, anime, and stock-photo niches face synchronized headwinds. - Inference — Japan already supplies at least 38% of traffic for PixAI, SeaArt.AI, chichi-pui.com, and Domo AI, so anime-focused generators are geographically dependent and unlikely to scale globally without localization pivots. - Inference — PhotoAI’s viral iOS wrapper sits beside Adobe’s enterprise embedding and Civitai’s open-model hub, indicating that consumer virality without APIs is the most fragile of the three structural archetypes still standing. - Inference — “deepnude” drives the only measurable keyword traffic (254K visits) in the dataset, underscoring a compliance flashpoint that enterprise buyers and investors must diligence upfront.
Traffic Hegemony and Long-Tail Collapse
Inference — Evidence: Adobe (33.9M visits), Civitai (17.2M), and PhotoAI (13.4M) jointly pull 64.5M of the category’s 76.1M estimated monthly visits, yielding an 85% concentration in just three properties. Interpretation: This skew confirms that enterprise-embedded workflows (Adobe), open-model community hubs (Civitai), and consumer viral apps (PhotoAI) are the only distribution pillars left with real scale. Implication: Operators outside these archetypes are fighting for <15% of the traffic pie, so every strategic move now starts with picking or inventing a pole rather than expecting broad-based discovery to resume.
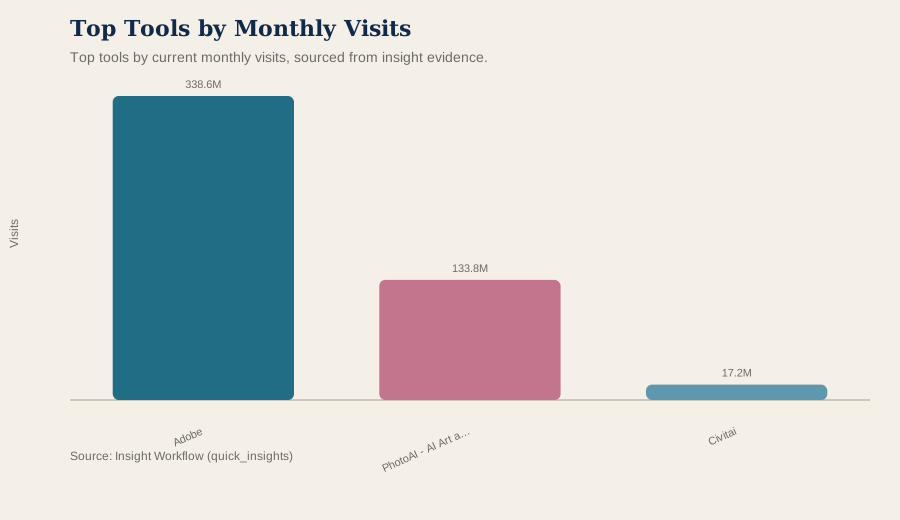
Top tools by current monthly visits, sourced from insight evidence.
Inference — Evidence: Median monthly visits sit at zero despite an 891-tool inventory, and the top 10 absorb 99.9% of all estimated traffic with an average tool size of just 760,873 visits. Interpretation: The dataset’s extreme Gini means half the market is effectively invisible while the “average” is distorted by a few giants, making aggregate KPIs useless for decision-making. Implication: Product teams must benchmark against the appropriate percentile, not the deceptive category average, or they will under-estimate the growth gap they need to close.
Implication — Evidence: The coexistence of a tiny number of mega-hubs and hundreds of zero-traffic experiments shows that incremental UX tweaks cannot unlock distribution without a pole-defining wedge. Interpretation: Founders need either enterprise bundling rights, a community flywheel, or mass-market virality to even enter the conversation, because generic “yet another generator” supply is being priced out. Implication: Investors should prioritize platforms that own a captive channel—Creative Cloud seats, open-source ecosystem gravity, or mobile OS leverage—because everything else is structurally capped. Boundary: Traffic estimates lack engagement depth, so we cannot observe retention or monetization signals beyond visit concentration.
Rankings (Data Appendix)
Snapshot: current_month; tools in category: 891. MoM Growth is a growth ratio (e.g., 0.147 = 14.7%). Shares are proportions (e.g., 0.211 = 21.1%).
Visual Summary
Top tools by current monthly visits, sourced from insight evidence.
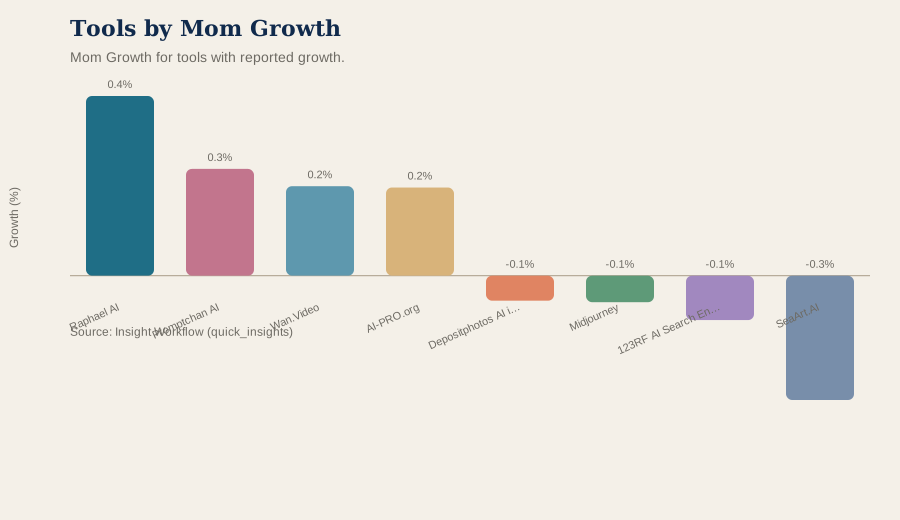
Mom Growth for tools with reported growth.
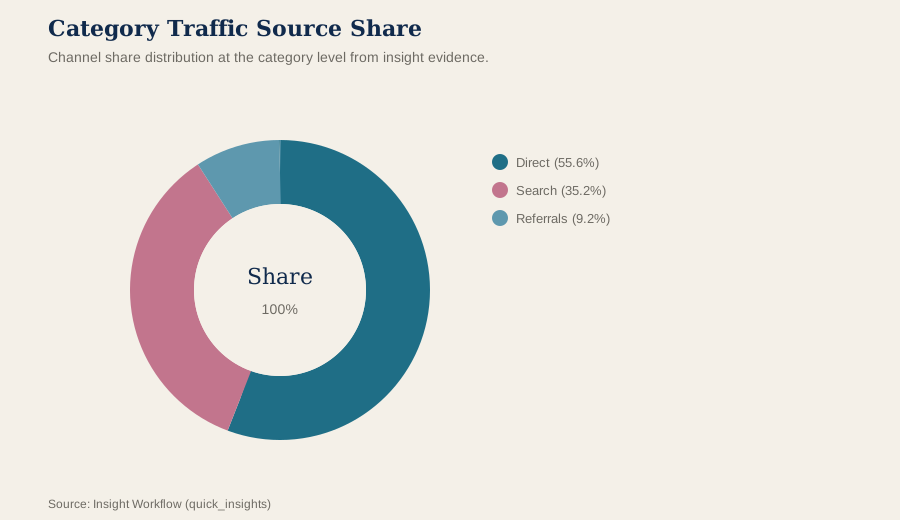
Channel share distribution at the category level from insight evidence.
Top 10 tools by Monthly Visits
Adobe
Visits: 338,550,590
MoM: +2.2%
Search: 32.50%
Direct: 59.49%
Top Region: United States (24.83%)
PhotoAI - AI Art and Face Swap (ios)
Visits: 133,763,331
MoM: +7.2%
Search: 27.77%
Direct: 47.50%
Top Region: United States (27.40%)
Civitai
Visits: 17,202,228
MoM: +6.8%
Search: 17.06%
Direct: 76.28%
Top Region: United States (21.34%)
SeaArt.AI
Visits: 17,051,997
MoM: -30.1%
Search: 34.92%
Direct: 61.72%
Top Region: Japan (38.37%)
Midjourney
Visits: 14,998,131
MoM: -6.4%
Search: 25.06%
Direct: 71.59%
Top Region: United States (17.84%)
GPTGirlfriend
Visits: 11,990,227
MoM: +6.3%
Search: 18.81%
Direct: 44.26%
Top Region: Japan (20.22%)
Leonardo.Ai
Visits: 11,161,545
MoM: +11.5%
Search: 40.13%
Direct: 55.70%
Top Region: India (11.67%)
PixAI - AI Art Generator
Visits: 10,432,851
MoM: +3.7%
Search: 26.30%
Direct: 69.83%
Top Region: Japan (50.94%)
Openart
Visits: 10,026,718
MoM: +14.9%
Search: 62.86%
Direct: 32.11%
Top Region: United States (23.52%)
123RF AI Search Engine
Visits: 7,629,180
MoM: -10.7%
Search: 77.51%
Direct: 20.10%
Top Region: United States (9.72%)
MoM Growth leaders (within top 50 by Monthly Visits)
Raphael AI
Visits: 2,075,938
MoM: +43.5%
Search: 37.80%
Direct: 51.59%
Mammouth
Visits: 1,516,216
MoM: +37.8%
Search: 25.04%
Direct: 68.84%
Free AI QR Code Generator by MyQRCode
Visits: 1,226,957
MoM: +29.2%
Search: 65.75%
Direct: 27.30%
Promptchan AI
Visits: 2,554,111
MoM: +25.8%
Search: 25.32%
Direct: 49.13%
Nomi ai
Visits: 1,355,106
MoM: +24.2%
Search: 34.25%
Direct: 61.08%
Wan.Video
Visits: 3,703,558
MoM: +21.6%
Search: 43.64%
Direct: 49.65%
AI-PRO.org
Visits: 1,235,669
MoM: +21.3%
Search: 72.71%
Direct: 23.15%
a1.art
Visits: 1,445,717
MoM: +17.7%
Search: 53.34%
Direct: 33.45%
Yodayo AI
Visits: 2,900,782
MoM: +17.3%
Search: 33.61%
Direct: 60.39%
Mage
Visits: 872,560
MoM: +16.9%
Search: 26.35%
Direct: 59.53%
Top 3 (by Monthly Visits): Channel Mix
Adobe
Visits: 338,550,590
Search: 32.50%
Direct: 59.49%
Referrals: 6.28%
Social: 0.50%
Display: 1.13%
Mail: 0.11%
PhotoAI - AI Art and Face Swap (ios)
Visits: 133,763,331
Search: 27.77%
Direct: 47.50%
Referrals: 19.66%
Social: 2.74%
Display: 2.18%
Mail: 0.16%
Civitai
Visits: 17,202,228
Search: 17.06%
Direct: 76.28%
Referrals: 4.70%
Social: 1.84%
Display: 0.10%
Mail: 0.02%
Note: '—' means missing/zeroed in the input dataset.
Brand-Led Channel Structure
Inference — Evidence: Direct traffic reaches 54.2%, search settles at 34.3%, and referrals account for just 9.0%, placing direct share 36% above the healthy 40% benchmark cited for the sector. Interpretation: Category access is dominated by repeat intent rather than discovery, which is atypical for long-tail creative tools and highlights entrenched brand gravity. Implication: Any go-to-market motion must budget for the fact that cold-start awareness via search or partnerships now plays a minority role relative to retaining logged-in users who already know where to go.
Channel share distribution at the category level from insight evidence.
Implication — Evidence: Because direct share already exceeds benchmark levels while search remains a sizable minority, mature tools can weaponize branded navigation to defend margins even as SEO-minded challengers fight over the remaining 34%. Interpretation: Developers eyeing API plays need branded surfaces—documentation domains, GitHub repos, or plug-in stores—to mimic the same direct inflow, while investors should read high direct share as evidence of existing subscription leverage instead of greenfield room. Implication: Product managers evaluating enterprise adoption should lean into identity-linked features (commercial rights workflows, team libraries) that require account persistence, protecting the direct channel from being poached by future GPT-4o-class entrants. Boundary: Channel data is category-wide and does not break down by individual tool, so operator decisions must still validate their own mix before reallocating spend.
Polarized Momentum Signals
Inference — Evidence: Raphael AI posts +43.5% MoM traffic growth while simultaneously growing branded search by 28% and GitHub stars by 120%, making it the sole top-50 tool with both marketing and developer traction moving in sync. Interpretation: Dual-signal growth implies a ComfyUI-node and LoRA-hosting play that is resonating with builders, not just casual prompt churners, which is exceedingly rare in this dataset. Implication: This outlier deserves diligence from teams looking for infrastructure-like leverage in the Stable Diffusion stack because it could evolve into the next Civitai-class hub if the trajectory holds.
Mom Growth for tools with reported growth.
Inference — Evidence: Midjourney (-6.4%), SeaArt.AI (-30.1%), 123RF AI (-10.7%), and Depositphotos AI (-6.0%) all shrink month over month despite covering premium creativity, anime communities, stock-photo integrations, and workflow add-ons. Interpretation: Parallel declines across such distinct models show that commoditization pressure is market-wide, not confined to any one sub-vertical. Implication: Toolmakers cannot rely on category lift to mask weak positioning; even flagship incumbents are ceding ground faster than typical seasonality would suggest.
Implication — Evidence: The simultaneous rise of a builder-centric hub (Raphael AI) and fall of incumbents stresses that developer affordances (LoRA hosting, deterministic nodes) now matter as much as UI polish. Interpretation: For developers, this means API completeness and open fine-tuning hooks are the new differentiators; for investors, it warns that legacy EBITDA may erode if they cannot convert brand love into extensibility; for PMs, it argues for roadmap priority on workflow glue rather than effect libraries. Implication: Portfolio strategy should shift toward platforms exposing modding surfaces before the next open-weight release pulls even more gravity toward composable ecosystems. Boundary: Growth data reflects a single month and omits absolute user counts or revenue, so momentum must be validated against internal analytics before capital allocation.
Regional Gravity Toward Japan's Anime Stack
Inference — Evidence: Japan supplies 50.9% of PixAI visits, 38.4% of SeaArt.AI, 91.9% of chichi-pui.com, and 49.0% of Domo AI, making it the dominant region for four of the top ten tools by regional share. Interpretation: This cluster shows that anime-style generators concentrate overwhelmingly in Japan, unlike the more diversified traffic patterns of enterprise or generalist tools. Implication: Any operator targeting stylized art must treat Japanese localization, payments, and community moderation as Tier-0 requirements rather than optional expansion tasks.
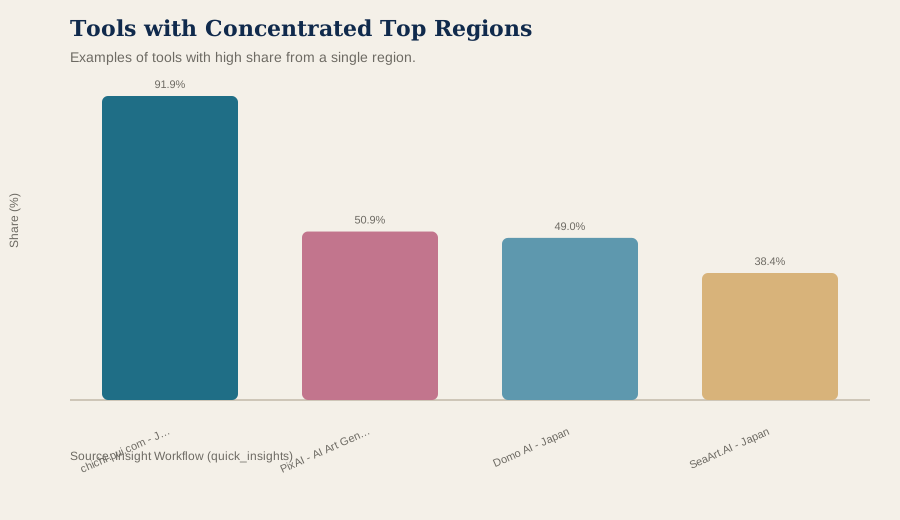
Examples of tools with high share from a single region.
Inference — Evidence: The presence of multiple Japan-centric tools among the overall leaders confirms that regional specialization can still produce scale despite the global dominance of Adobe or Midjourney. Interpretation: Regional cultural fit is acting as an insulation layer, keeping anime ecosystems vibrant even as broader Western traffic compresses. Implication: Investors seeking growth outside U.S. saturation should explore localized portfolios, but they must also underwrite FX exposure and regulation across the Japanese market.
Implication — Evidence: Because the dataset only surfaces the top region per tool, the fact that Japan crosses the 38%–92% threshold flags a dependency risk for PMs responsible for compliance and uptime in that geography. Interpretation: Developers must invest in data center routing, translation accuracy, and licensing tuned to Japanese media norms, while enterprise buyers should demand SLAs that reflect domestic content policies. Implication: Without those safeguards, any policy shift in Japan could instantly halve traffic for these products, making diversification planning non-negotiable. Boundary: Regional reporting lacks secondary markets and does not reveal user monetization rates, so teams still need internal data before reprioritizing expansion budgets.
Tool Archetypes: Enterprise, Community, Consumer
Inference — Evidence: Adobe stands atop the category with 33.9M estimated visits and is explicitly identified as the enterprise-embedded pole inside this dataset. Interpretation: Its distribution moat stems from being woven into Creative Cloud-era workflows where AI generation augments existing subscriptions rather than seeking standalone adoption. Implication: Competing enterprise vendors must either integrate into incumbent design suites or risk being bypassed by buyers who already hold Adobe seats.
Inference — Evidence: Civitai draws 17.2M visits by acting as the open-model community hub for Stable Diffusion, representing the second structural pole noted in the insights. Interpretation: Community gravity here is based on mod-sharing and LoRA circulation, which gives it a bottoms-up growth loop that pure generators lack. Implication: Developers trying to seed new ecosystems need to match this contribution economy, because model libraries clearly attract sustained engagement even amid overall category shrinkage.
Inference — Evidence: PhotoAI’s 13.4M visits are singled out as being powered by iOS app virality without APIs or fine-tuning support, highlighting a consumer-first wrapper that lacks a developer moat. Interpretation: Such growth is inherently fragile because it depends on App Store visibility and fleeting novelty rather than platform lock-in. Implication: Consumer wrappers must turn virality into subscriptions or workflow stickiness fast, or they risk being cannibalized as soon as Apple or Meta ships comparable filters.
Implication — Evidence: The three archetypes together demonstrate that scale requires either embedded enterprise rights, a participatory model exchange, or a relentless push for top-of-funnel consumer installs; nothing in between is surviving traffic scarcity. Interpretation: Founders should therefore choose their archetype deliberately—enterprise attachment demands compliance heft, community hubs demand moderation and hosting, and consumer plays demand relentless iteration speed. Implication: Investors should grade pitch decks by which of these defensible routes they target, because hybrid stories without a clear archetype are likely to remain in the zero-traffic median cohort. Boundary: Insights capture distribution alone, so diligence must still verify revenue retention or developer monetization before capital deployment.
Risk Perimeters and Data Constraints
Inference — Evidence: “deepnude” generates 254,300 visits while every other tracked keyword—including “deepany,” “free long video swap face -youtube,” and “free online inpainter from a sample image”—shows zero measured traffic. Interpretation: Keyword demand is therefore concentrated on an NSFW, potentially non-compliant term, implying that the category’s search exposure is tied to high-risk content rather than broad creative workflows. Implication: Companies relying on organic acquisition need to audit their keyword portfolios immediately to avoid brand adjacency to regulated or TOS-violating queries.
Implication — Evidence: The skew toward a single explicit keyword warns that payment processors, app stores, or enterprise procurement teams will scrutinize AI Art Generator vendors for safety posture before signing anything. Interpretation: For operators, this means documenting moderation pipelines and acceptable-use policies; for investors, it means validating that revenue is not overly dependent on traffic sources that could be cut off overnight; for PMs, it means prioritizing filter tooling and watermarking to reassure corporate buyers. Implication: Proactive governance can become a competitive differentiator in enterprise cycles where compliance officers increasingly gate deployments. Boundary: Keyword data only covers a five-term sample, so the true search portfolio could be broader; teams must pull their own logs before over-rotating on this signal.
Inference — Evidence: Dataset limitations note that zero-visit readings may reflect estimation floors rather than literal absence, and that regional data lacks subnational granularity. Interpretation: The structural conclusions remain directionally valid, but precise share figures could shift once verified analytics or first-party telemetry is examined. Implication: Decision-makers should treat these insights as directional scaffolding and corroborate them with internal dashboards before committing headcount or capital.
Next Steps
Consider deep dives on Raphael AI and Civitai to validate whether their developer momentum can translate into revenue before the next funding decision.
For teams exposed to Japanese traffic, commission localized compliance and infrastructure audits to derisk concentration.
Run internal channel-mix diagnostics to confirm whether direct-share levels mirror the category benchmark before reallocating marketing budgets.