Firebase Studio logs 815,167 monthly visits—about 15× the 55,153|AI App Builder

Executive Summary
Firebase Studio logs 815,167 monthly visits—about 15× the 55,153 category average—so challengers need complementary or vertical wedges instead of frontal parity bids.
Median traffic sits at 1,439.5 (97% below the mean) across 32 tracked tools, keeping the field barbelled and forcing investors to discount mid-tier claims unless the acquisition story is airtight.
Tempo Labs and CodeNext AI are the only products more than doubling month over month (2.67× and 2.53×), so they warrant breakout diligence even though their baselines remain undisclosed.
Audoir.com (-0.847 MoM) and CraftAI (-0.742) show how funnels can implode inside a single cycle, making distribution stability more important than feature breadth for survival.
Category traffic skews 46.26% search versus 41.27% direct, so dev-tool launches that underinvest in both SEO capture and brand budgets will plateau before meaningful pipeline forms.
iSwift.dev depends on 71.88% search and just 12.61% direct traffic, so algorithm swings could cap growth unless PMs build logged-in or owned-channel loops early.
AppGen’s traffic is 61.23% Philippine, with Brazil at 10.28% and the United States at 8.77%, proving geo-heavy funnels need pricing and partnerships tuned to the lead market before expanding outward.
MoM ratios lack prior baseline visits and channel metrics remain category-level only, so operators should treat the dataset as directional signal rather than proof of durable scale. (I003, I005)
Firebase Dominance Reshapes Benchmarks
Firebase Studio commands 815,167 monthly visits—roughly 15× the 55,153 category average—so every distribution conversation now assumes coexistence with its orbit. The scale reflects entrenched brand recall and Firebase’s cloud-integrated workflow, leaving little room for horizontal “studio” clones; founders should explore partnerships, extensions, or adjacent tooling instead of direct replacement bids.
The same gap means product managers must anchor benchmarks to conversion or activation rather than raw traffic: matching Firebase’s visitors is unrealistic, but matching its activation rate for specific builder cohorts can be viable. Buyers expect best-of-breed integrations, so teams either need to dominate a micro-vertical or win on governance and enterprise constraints, ideally through SDKs and plugin hooks where Firebase still leaves surface area open.
Investors should treat Firebase as distribution infrastructure similar to how AWS functioned in 2014; the most credible startups act as force multipliers for Firebase workflows—observability, compliance, vertical data connectors—rather than pure replacements. Diligence should prioritize shared authentication, billing, or co-selling signals that prove Firebase-linked adoption.
Long Tail Economics Force Specialized Plays
Category median monthly visits languish at 1,439.5, a 97% shortfall versus the 55,153 average, which means the typical AI app builder barely attracts more than a few thousand curious visitors. Because the mean is inflated by Firebase and a few mid-tier tools, most teams compete through micro-communities and single-channel hacks; smaller groups should define pinpoint segments—regulated industries, locale-specific compliance, workflow verticals—where a few hundred loyal teams justify survival.
Even though 32 tools crowd the dataset, only a handful reach meaningful scale, confirming that horizontal features alone no longer win attention. When half the catalog sees fewer than 2,000 visits, pricing power and investor narratives must hinge on pipeline quality over volume; founders need to show integration depth, proprietary data, or customer intimacy, while investors scrutinize whether go-to-market plans identify a specific buyer and attach rate.
For larger incumbents, spinning up another generalist builder dilutes resources, whereas enabling builders with templates, compliance guardrails, or domain-trained agents creates leverage. The skewed distribution shows that chat-to-app and drag-and-drop parity is commoditized, so differentiation has to come from downstream deployment guarantees or enterprise controls.
Momentum Signals Separate Watchlists From Triage
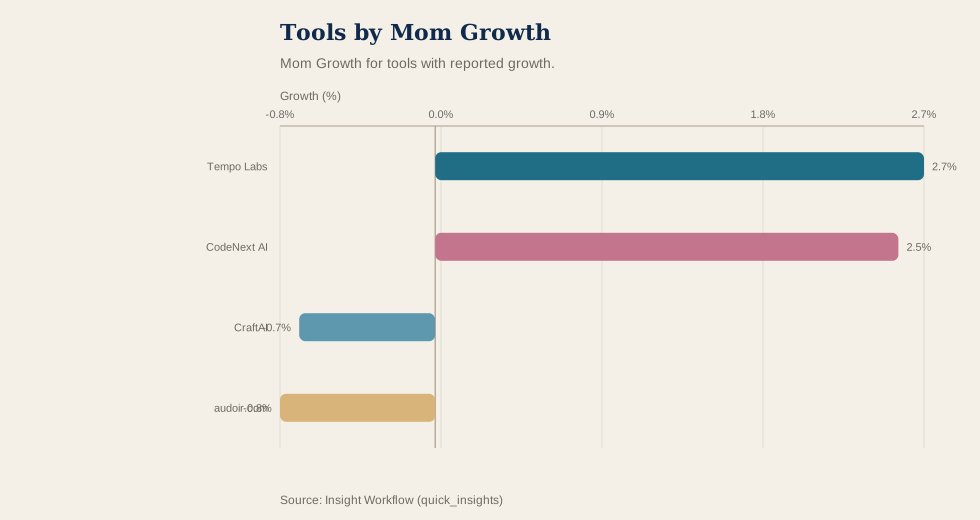
Tempo Labs and CodeNext AI are the only tracked products more than doubling month over month, at 2.67× and 2.53×. Baselines remain undisclosed, so the jumps could represent tens of thousands of users or just a few thousand, but the direction flags campaigns or partnerships worth reverse-engineering; investors should prioritize diligence on these spikes while developers monitor whether either team builds an ecosystem or stays a point solution.
The growth chart below shows only Tempo Labs and CodeNext AI clearing the 2.5× line while most peers stay flat, underscoring how rare true acceleration is in this cohort. Winners are isolated outliers, so operators should study them for R&D inspiration yet pressure-test whether the momentum survives once paid boosts or launch buzz fade.
Mom Growth for tools with reported growth.
Audoir.com’s -0.847 MoM ratio and CraftAI’s -0.742 slide illustrate the opposite extreme, where traffic craters inside a month and exposes referral or campaign dependencies that suddenly dried up. Those drops imply acquisition wells that were never diversified, making the companies risky for revenue forecasts and morale; turnaround teams must rebuild awareness—via niche partnerships or migration incentives—before touching product, and investors should demand distribution triage plans before offering rescue capital.
Channel Dependence Sets Go-To-Market Risk
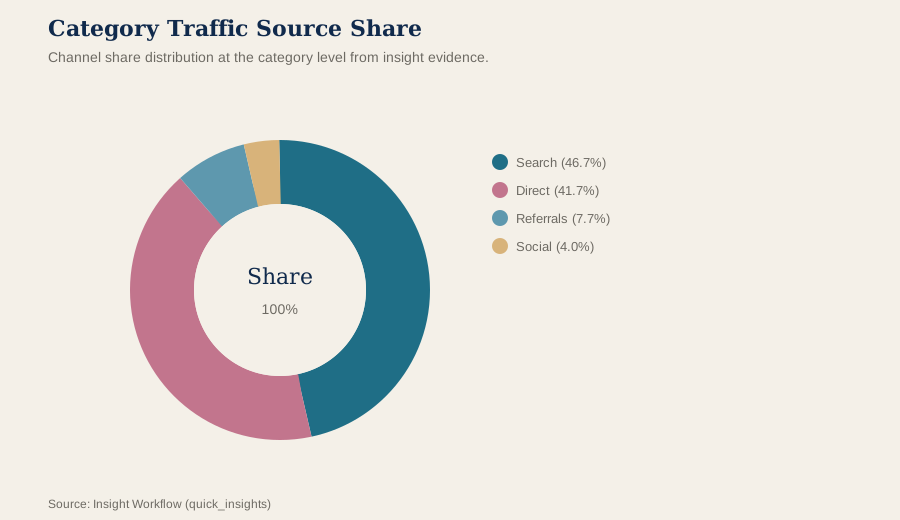
Across the category, 46.26% of visits come from search versus 41.27% direct, with referrals at 7.62% and social at 3.92%, indicating that incumbents already own both branded pull and SEO capture. Late entrants therefore need simultaneous budgets for technical SEO—docs, templates, community content—and brand work through events or partnerships, because leaning on one channel caps growth.
The channel-share snapshot shows search holding a five-point edge over direct while referrals and social barely register, so any algorithmic or behavior change in those dominant channels will ripple across the field. Teams should build owned media such as email sequences or in-product education so that a future search or brand shock does not cripple pipeline creation.
Channel share distribution at the category level from insight evidence.
iSwift.dev embodies this fragility: 71.88% of its visits originate from search, with only 12.61% direct and 7.72% social, meaning one Google update could erase most of its funnel. Product teams should prioritize logged-in experiences, community programs, or alliances that convert search visitors into owned audiences, and investors should challenge any forecast that fails to show rising direct share within two quarters.
Regional Concentration Limits Scaling
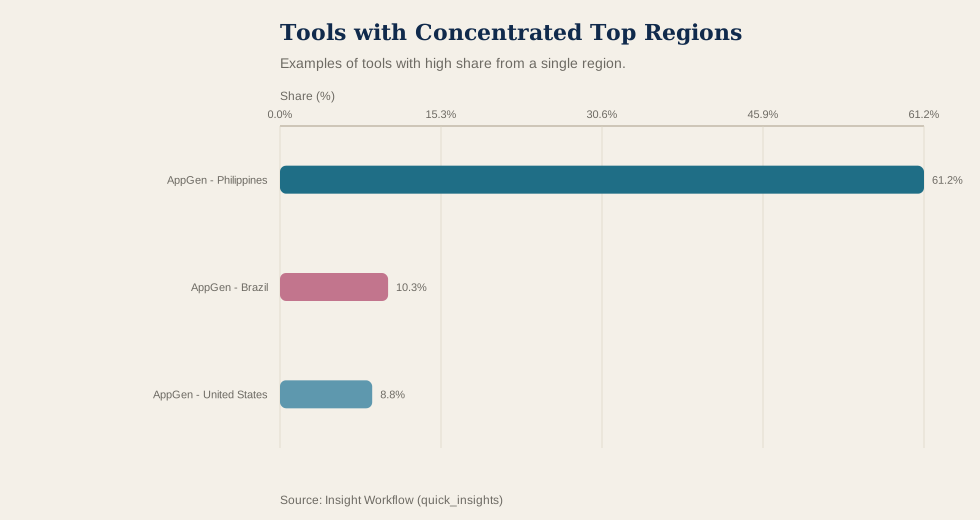
AppGen draws 61.23% of its traffic from the Philippines, with Brazil contributing 10.28% and the United States 8.77%, so monetization and support models must fit Philippine realities before broader expansion. That concentration can be a strength—deep local resonance—but it also caps revenue per user if pricing assumes U.S. budgets, so founders should lean on Filipino partnerships, telecom bundles, or payments integrations to maximize conversion first.
The region-concentration chart shows the Philippines dominating AppGen’s stack while others stay in low double digits, underscoring how dependent the product is on a single locale. Exposure to one market heightens sensitivity to local economic shifts, regulation, or new entrants, so diversification should begin with culturally proximate markets and localized content rather than broad global campaigns.
Examples of tools with high share from a single region.
Data stops at the top five countries for AppGen, leaving no evidence of a latent long tail; decision-makers should assume non-top-five contributions are minimal until instrumentation proves otherwise. Product teams need geo-level onboarding and billing metrics so secondary-market signals are visible, giving investors more confidence when funding international expansion.
Data Blind Spots and SERP Context
MoM ratios for both the growth outliers and the decliners omit prior-month visit counts, so a 2.5× multiple could mean a jump from 2,000 to 5,000 visits or something larger; without absolutes, interpretations must stay directional. Investors and product leads should request raw traffic disclosures or triangulate third-party analytics before treating these ratios as proof of durable scale.
Channel data is only available at the aggregate level besides a few point examples, and keyword-level intel is absent, making it impossible to distinguish branded search from generic problem queries. Operators need their own keyword tests and brand-lift surveys, while investors should remain skeptical of any organic-dominance claim without audited search-term breakdowns.
SERP snippets for OnSpace.AI read like directory blurbs rather than substantive coverage, so they offer little explanation for sudden traffic shifts; without campaign calendars or referral data, causality remains unproven and SERP chatter should be treated as a soft signal only.
Rankings (Data Appendix)
Snapshot: current; tools in category: 32. MoM Growth is a growth ratio (e.g., 0.147 = 14.7%). Shares are proportions (e.g., 0.211 = 21.1%).
Visual Summary
Mom Growth for tools with reported growth.
Channel share distribution at the category level from insight evidence.
Top 10 tools by Monthly Visits
Firebase Studio
Visits: 815,167
MoM: -9.7%
Search: 59.46%
Direct: 32.48%
Top Region: India (17.30%)
OnSpace.AI: App Builder AI No-code Platform
Visits: 387,875
MoM: +62.2%
Search: 26.35%
Direct: 54.18%
Top Region: Nigeria (26.20%)
Glif
Visits: 245,586
MoM: -23.5%
Search: 36.19%
Direct: 53.05%
Top Region: Brazil (24.68%)
Vitara AI
Visits: 106,522
MoM: +20.5%
Search: 44.28%
Direct: 40.48%
Top Region: United States (13.74%)
RapidNative
Visits: 100,523
MoM: +6.0%
Search: 39.78%
Direct: 40.53%
Top Region: India (11.58%)
chainlit.io
Visits: 54,831
MoM: -26.3%
Search: 46.12%
Direct: 41.68%
Top Region: India (16.12%)
AppGen
Visits: 23,888
MoM: -12.5%
Search: 62.11%
Direct: 24.59%
Top Region: Philippines (61.23%)
iSwift.dev
Visits: 5,524
MoM: +134.1%
Search: 71.88%
Direct: 12.61%
Top Region: United States (82.27%)
questAI
Visits: 4,119
MoM: +5.4%
Search: 38.51%
Direct: 42.39%
Top Region: United States (40.35%)
WrapFast
Visits: 3,819
MoM: -13.0%
Search: 41.28%
Direct: 38.51%
Top Region: India (39.15%)
MoM Growth leaders (within top 21 by Monthly Visits)
Tempo Labs
Visits: 1,797
MoM: +266.7%
Search: 40.12%
Direct: 42.70%
CodeNext AI
Visits: 836
MoM: +252.7%
Search: 43.22%
Direct: 37.72%
Code99
Visits: 1,407
MoM: +140.1%
Search: 32.66%
Direct: 42.30%
iSwift.dev
Visits: 5,524
MoM: +134.1%
Search: 71.88%
Direct: 12.61%
OnSpace.AI: App Builder AI No-code Platform
Visits: 387,875
MoM: +62.2%
Search: 26.35%
Direct: 54.18%
Fuselio
Visits: 3,658
MoM: +56.9%
Search: 34.87%
Direct: 36.37%
Vitara AI
Visits: 106,522
MoM: +20.5%
Search: 44.28%
Direct: 40.48%
ShipFlutter
Visits: 1,248
MoM: +20.1%
Search: 37.85%
Direct: 38.11%
Car Part Identifier
Visits: 2,129
MoM: +10.8%
Search: 48.94%
Direct: 20.95%
RapidNative
Visits: 100,523
MoM: +6.0%
Search: 39.78%
Direct: 40.53%
Top 3 (by Monthly Visits): Channel Mix
Firebase Studio
Visits: 815,167
Search: 59.46%
Direct: 32.48%
Referrals: 5.11%
Social: 2.14%
Display: 0.73%
Mail: 0.08%
OnSpace.AI: App Builder AI No-code Platform
Visits: 387,875
Search: 26.35%
Direct: 54.18%
Referrals: 12.62%
Social: 5.88%
Display: 0.69%
Mail: 0.29%
Glif
Visits: 245,586
Search: 36.19%
Direct: 53.05%
Referrals: 5.43%
Social: 4.64%
Display: 0.60%
Mail: 0.08%
Note: “—” means missing or zeroed in the input dataset.