AI API Market Analysis Report

Executive Summary
Claude 2's 57.3% visit share turns the AI API category into a single-flagship strong concentration effect, so challengers must either orbit it or define a niche outside its wake.
Half of the 354 tracked tools report zero traffic, making the 693,232 average meaningless and forcing diligence to anchor on the >99% share controlled by the top 10.
Direct navigation already supplies 70.9% of all category acquisition, confirming that channel mix measures brand maturity instead of presenting a tweakable lever.
Tools clearing 1M visits average 62.3% direct share while sub-1M tools sit at 42.1%, so sub-scale founders should invest in awareness loops rather than premature brand spend.
Sloyd and Tripo AI are the only scaled tools posting >50% MoM growth, underscoring how rare breakout velocity is and why investors must interrogate loop mechanics instead of headline ratios.
GPTunneL's -35.4% MoM drop on 833,083 visits shows how a single-region funnel can reverse overnight, especially with 73.19% of its traffic tied to Russia.
Two music-generation keywords—“elevenlabs” at 2.6M visits and “suno” at 2.2M—absorb most organic demand, forcing non-audio APIs to lean on direct acquisition.
U.S. leadership across 12 of 25 tools hides a 10%-80% spread in national dependence, so PMs must treat regionalization as a binary design choice, not an afterthought.
Monopolized Demand Architecture
Claude 2 captures 57.3% of total monthly visits, effectively defining the demand surface for all 354 AI API tools.
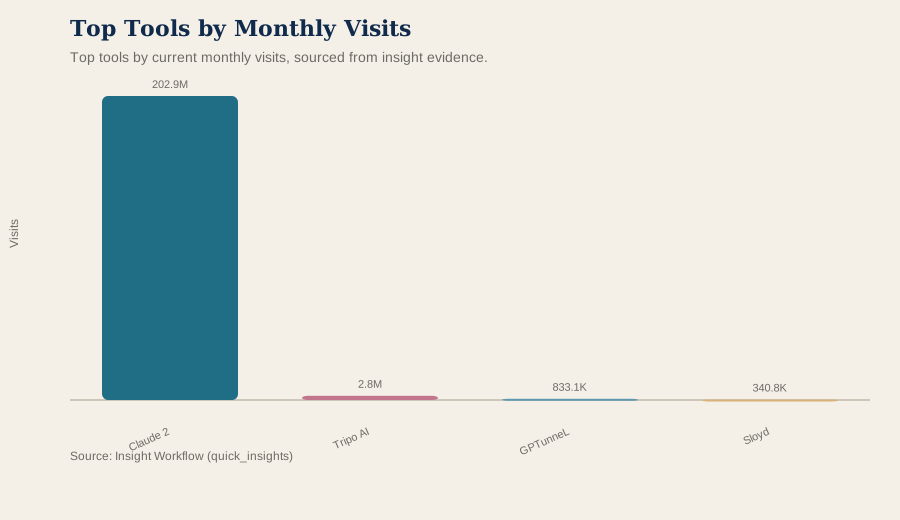
Top tools by current monthly visits, sourced from insight evidence.
Why it matters: A single flagship owning the category throttles discovery liquidity for everyone else. Operator takeaway: Treat Claude as either a platform to integrate with or a moat you must route around; there is no neutral position.
Half the landscape logs zero traffic, turning the 693,232 average into a statistical mirage created by a handful of runaway winners. Because the top 10 tools control more than 99% of total visits, benchmarking against category means only recycles survivor bias. Investors should mark any pitch leaning on category medians as a distribution-blind red flag.
Even high-traffic contenders like Tripo AI with 2,771,824 visits sit in Claude's shadow, proving that scale still clusters inside a single orbit. Developers chasing general-purpose assistants are therefore agreeing to fight the incumbent's default mindshare rather than merely copying its API surface. Enterprise buyers and investors should prioritize vendors that anchor on differentiated datasets, compliance, or latency guarantees because raw traffic claims remain tiny beside Claude.
With 354 tools in scope yet only a sliver showing measurable demand, distribution strategy becomes a traffic-allocation contest rather than a feature race, pushing founders toward partnerships, bundling, or platform niches over net-new horizontal launches. Investors should translate this into a diligence checklist focused on channel control and privileged data access because those are the only levers left when the market already behaves like a monopoly.
Channel Stack as Maturity Signal
Direct navigation supplies 70.9% of category-wide acquisition versus 24.8% from search, leaving referrals at 3.08% and social at 0.80%.
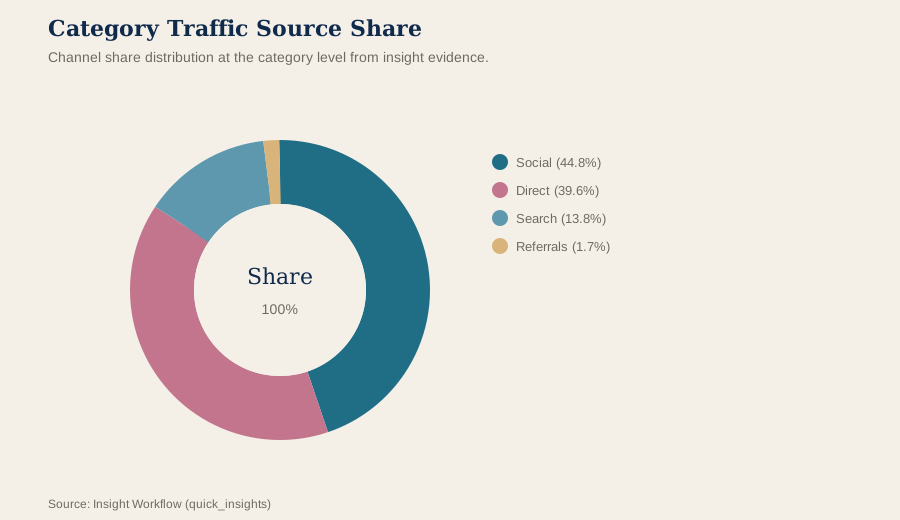
Channel share distribution at the category level from insight evidence.
Why it matters: Once users default to typing your URL, incremental acquisition levers shrink dramatically. Operator takeaway: Invest in trust-building content, documentation, and SLAs because they are prerequisites for that direct skew.
Tools above 1M visits average 62.3% direct share while sub-1M peers hover near 42.1%, confirming that channel mix mirrors scale instead of causing it. Claude 2's 75.06% direct share contrasts with Luma AI's 48.83%, framing the latter as still reliant on discovery loops despite similar API narratives. Developers pacing around the 42% band should prioritize tutorials, SDK samples, and integration showcases before chasing sponsorships or merchandise plays.
klingai.com runs at 57.97% direct share compared with Branded's 77.25%, highlighting the gulf between AI-native creative platforms and trust-heavy research marketplaces. For developers, that gap implies API SDK investments compound only after direct share approaches the 57.97%-77.25% band represented by these tools, while investors should discount referral-heavy decks that contradict the category's 70.9% direct gravity. Enterprise PMs can treat high-direct vendors as safer integration bets while piloting lower-direct challengers only when their niche capability outweighs the expected support load.
Region Dependency Splits the Field
The United States leads traffic for 12 of the 25 sampled tools, and national share spans from 10.1% at klingai.com to 79.9% at Branded.
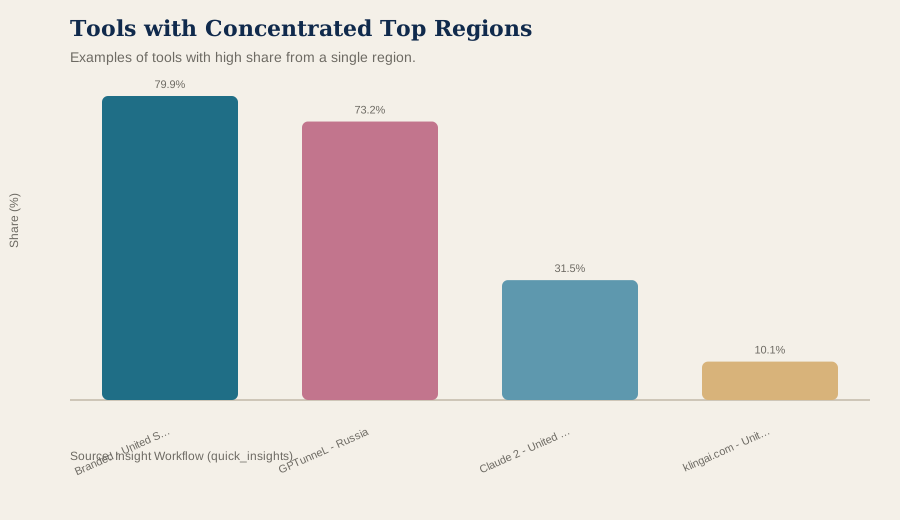
Examples of tools with high share from a single region.
Why it matters: Region mix is a binary constraint that hardcodes regulatory and payment priorities. Operator takeaway: Decide early whether to double down on the U.S. stack or architect for multilingual compliance; straddling both will dilute focus.
Claude 2 still leans on a 31.52% U.S. base while GPTunneL derives 73.19% of its visits from Russia, so geopolitics and localization can swing pipelines faster than product feature work. Developers targeting regulated buyers must treat U.S.-grade privacy and accessibility as table stakes, whereas creative platforms with low U.S. share need localized docs, billing, and support on day one. Investors should size region concentration like credit exposure because sanctions, censorship, or data-residency shifts can reprice an asset overnight.
Branded connects businesses with research participants and remains anchored in the United States until it proves a non-U.S. panel, while klingai.com's 10.1% U.S. share signals a deliberate bet on global creator demand. PMs choosing between these archetypes must align localization budgets with that spread instead of assuming gradual expansion.
Velocity Signals Are Scarce and Fragile
Sloyd's 51.6% MoM jump on 340,795 visits, Tripo AI's 50.8% surge on 2,771,824 visits, and GPTunneL's -35.4% slide on 833,083 visits show how few tools are actually moving at scale.
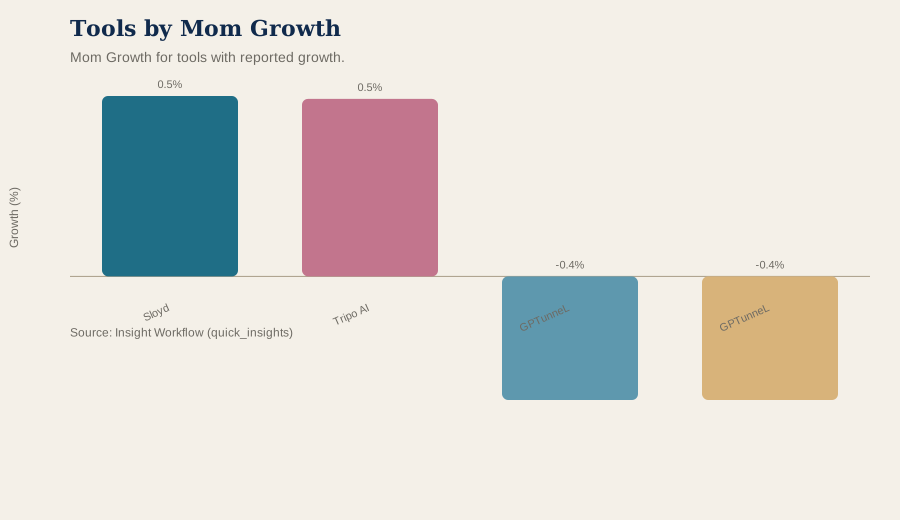
Mom Growth for tools with reported growth.
Why it matters: Growth outliers are rare, and declines can be just as abrupt when funnels rest on a single pillar. Operator takeaway: Treat MoM spikes and drops as diligence triggers, not as proof of momentum or failure.
Sloyd's 51.6% spike could stem from activation unlocks, integrations, or documentation virality, but the dataset flags short-term growth rates as potentially noisy, so diligence must focus on loop diagnostics rather than single data points. Developers evaluating whether to build on Sloyd should request integration telemetry, SLAs, and rate-limit transparency before committing workloads. Investors can treat the 51.6% ratio as a reason to inspect churn, onboarding pathways, and partner distribution instead of underwriting the headline.
GPTunneL's fall coincides with a 73.19% Russia dependency, meaning macro shocks or policy shifts can erase a third of its traffic without any product mistakes. Founders with similar geographic skew need redundant payment rails and mirrored infrastructure before volatility hits, not after. PMs considering GPTunneL-style vendors should demand contingency plans for sanctions, hosting, and billing before onboarding.
Tripo AI's simultaneous 2,771,824 visits and 50.8% MoM growth prove that visual and 3D model APIs can still break out when their distribution surfaces align with creator workflows, yet sustaining that arc will require channel diversification beyond direct navigation. Developers can interpret this as a signal to design export-friendly APIs that slot into existing 3D pipelines, while investors should probe whether the surge is translating into enterprise contracts or just consumer experimentation.
Keyword Gravity Locked in Music AI
The keywords “elevenlabs” at 2.6M visits, “suno” at 2.2M, and “suno ai” at 1.2M dwarf the remaining 20 tracked terms, making organic demand a two-brand story.
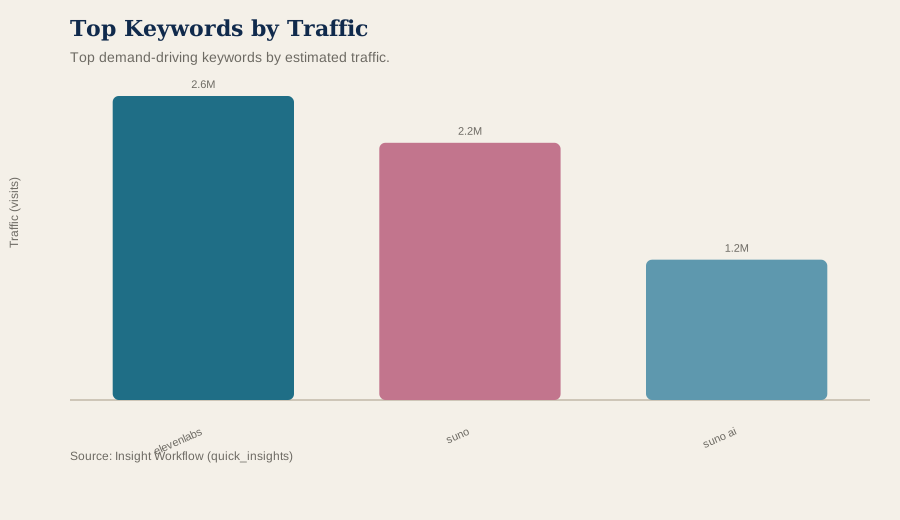
Top demand-driving keywords by estimated traffic.
Why it matters: Organic share is already spoken for by audio leaders, starving everyone else of search oxygen. Operator takeaway: If you are not a music tool, plan to win via direct, partner, or embedded distribution—not SEO.
Because keyword coverage stops at 22 terms with only 127,100 visits left for the rest, infrastructure, assistant, and data APIs should assume SEO returns are capped unless they piggyback on audio-related intents. Developers should redeploy marketing budgets toward community tutorials, integrations, or documentation showcases instead of chasing high-volume keywords that do not map to their category. Investors and PMs ought to require a convincing non-search acquisition story before funding or buying outside the music niche.
This keyword skew also clarifies why category search share stalls at 24.8%: the audio duopoly consumes the headroom, leaving every other API to compete for the scraps. Decision teams should therefore pair any search experiment with referral programs, integration marketplaces, or channel partnerships if they sit outside the audio boom.
Data Boundaries Worth Flagging
Median monthly visits registering at zero reflects instrument sensitivity as much as market reality, so founders with private or invite-only APIs may simply not appear yet. Zero-visit entries may represent private launches or attribution gaps, which means absence of traffic is not proof of failed product-market fit. Operators should treat the 693,232 average as a talking point, not evidence, because it is built on data that omits half the market.
Regional observations cover only 25 tools and growth rates rely on short-term deltas, so the U.S. share spread and the MoM spikes should be treated as directional signals rather than permanent baselines. Keyword CPC values sit at 0.0 across the sample, leaving acquisition cost modeling outside the scope of this dataset. Nothing here measures revenue, activation, or retention, so every decision should stay anchored in distribution math instead of financial proxies.
Rankings (Data Appendix)
Snapshot: current month; tools in category: 354. MoM Growth is a growth ratio (e.g., 0.147 = 14.7%). Shares are proportions (e.g., 0.211 = 21.1%).
Visual Summary
Top tools by current monthly visits, sourced from insight evidence.
Mom Growth for tools with reported growth.
Channel share distribution at the category level from insight evidence.
Top 10 tools by Monthly Visits
Claude 2
Visits: 202,932,461
MoM: +17.5%
Search: 21.62%
Direct: 75.06%
Top Region: United States (31.52%)
klingai.com
Visits: 14,627,387
MoM: +8.6%
Search: 37.26%
Direct: 57.97%
Top Region: China (10.64%)
Branded
Visits: 4,223,304
MoM: +2.0%
Search: 13.86%
Direct: 77.25%
Top Region: United States (79.90%)
Tripo AI
Visits: 2,771,824
MoM: +50.8%
Search: 45.40%
Direct: 45.80%
Top Region: United States (11.37%)
Luma AI
Visits: 2,409,304
MoM: +17.5%
Search: 43.24%
Direct: 48.83%
Top Region: United States (12.07%)
Nano Banana Pro API - Kie.ai
Visits: 1,563,253
MoM: -7.2%
Search: 32.74%
Direct: 48.62%
Top Region: United States (16.34%)
Kie.ai: Affordable & Secure DeepSeek R1 API
Visits: 1,563,253
MoM: -7.2%
Search: 32.74%
Direct: 48.62%
Top Region: United States (16.34%)
Topmediai
Visits: 1,460,802
MoM: +4.5%
Search: 69.40%
Direct: 25.32%
Top Region: United States (14.90%)
Bigjpg
Visits: 1,458,815
MoM: -5.0%
Search: 38.85%
Direct: 54.61%
Top Region: China (17.76%)
Rodin
Visits: 1,275,494
MoM: -10.6%
Search: 51.01%
Direct: 40.42%
Top Region: United States (12.26%)
MoM Growth leaders (within top 50 by Monthly Visits)
They See Your Photos
Visits: 195,442
MoM: +154.0%
Search: 39.09%
Direct: 43.59%
Miragic Virtual Try-on Clothes
Visits: 45,141
MoM: +66.5%
Search: 40.98%
Direct: 37.11%
surgehq.ai
Visits: 256,807
MoM: +64.1%
Search: 44.79%
Direct: 42.51%
Sloyd
Visits: 340,795
MoM: +51.6%
Search: 52.31%
Direct: 35.16%
Tripo AI
Visits: 2,771,824
MoM: +50.8%
Search: 45.40%
Direct: 45.80%
Stable Horde
Visits: 44,100
MoM: +41.0%
Search: 42.85%
Direct: 38.21%
Avaturn ME
Visits: 161,002
MoM: +38.9%
Search: 49.35%
Direct: 35.79%
AltText.ai
Visits: 52,205
MoM: +30.8%
Search: 42.66%
Direct: 45.07%
Remove Bg
Visits: 36,138
MoM: +28.0%
Search: 47.19%
Direct: 35.92%
HTTPie AI
Visits: 122,800
MoM: +27.3%
Search: 46.62%
Direct: 38.39%
Top 3 (by Monthly Visits): Channel Mix
Claude 2
Visits: 202,932,461
Search: 21.62%
Direct: 75.06%
Referrals: 2.55%
Social: 0.50%
Display: 0.22%
Mail: 0.04%
klingai.com
Visits: 14,627,387
Search: 37.26%
Direct: 57.97%
Referrals: 3.16%
Social: 1.20%
Display: 0.38%
Mail: 0.03%
Branded
Visits: 4,223,304
Search: 13.86%
Direct: 77.25%
Referrals: 5.05%
Social: 1.05%
Display: 2.58%
Mail: 0.21%
Note: '—' means missing/zeroed in the input dataset.