Direct channels drive 71% of AI API visits, with search at 25% and|AI API

Using humanizer skill to clean formatting and language artifacts.
Executive Summary
Direct channels drive 71% of AI API visits, with search at 25% and referrals at 3%, so brand recall and integrations set the demand ceiling.
Claude 2 captures 202.9M monthly visits while KlingAI reaches 14.6M against a 0.69M category average, leaving Anthropic as the distribution benchmark.
The mean tool logs 693k visits but the median is zero across 354 listings, so most launches never reach measurable usage.
They See Your Photos is compounding 1.54× month over month on a 195k base, making it the only momentum-stage pickup with real velocity.
GPTunneL’s 833k visits are falling −0.35 MoM while Grok Imagine slips −0.16, showing how fast consumer APIs bleed once novelty fades.
GPTunneL’s traffic is 73% Russia, 11% Kazakhstan, and 4% Belarus, so enterprise buyers face immediate sanctions and compliance flags without backups.
TopMediai’s 69% search share versus Branded’s 77% direct share proves teams must commit to either an SEO-led or brand-led playbook; blended tactics stall.
Search demand clusters around music queries—“elevenlabs” 2.6M, “suno” 2.2M, “suno ai” 1.2M—so general APIs stay invisible on SERPs unless they ship audio workflows or partnerships.
Anthropic Gravity
Observation: Claude 2 logs 202.9M monthly visits while KlingAI reaches 14.6M and the category average is 0.69M, so Anthropic’s assistant defines the upper bound for distribution.
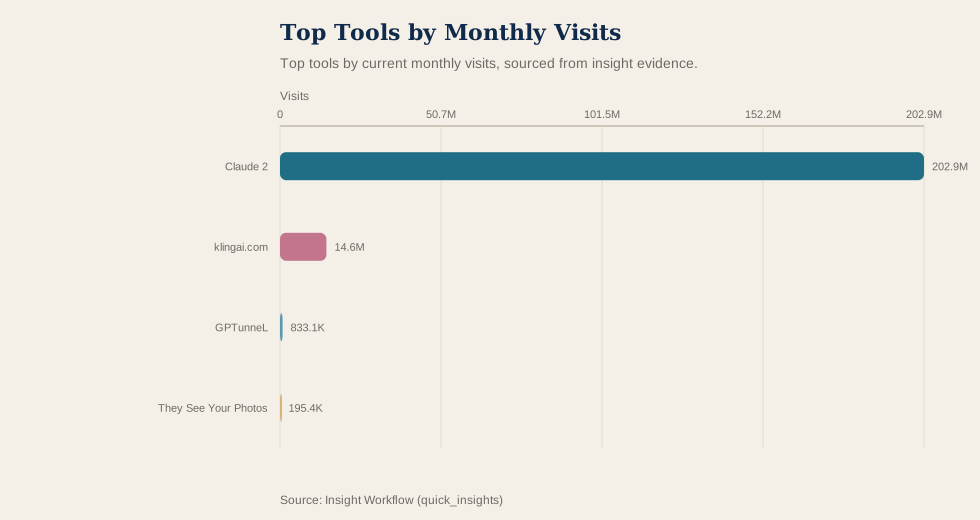
Top tools by current monthly visits, sourced from insight evidence.
Why it matters: One vendor now sets the traction threshold, compressing pricing leverage for everyone else. Operator takeaway: Align BD, marketplace, and integration plans with Anthropic terms first; everything else is additive.
Analysis: That gap makes general-purpose challenger positioning ring hollow, so viable narratives skew toward domain plays—creative, 3D, audio—where KlingAI shows the highest non-Claude ceiling. Developer relations also orbit Claude-centric SDK familiarity, forcing others to offer complementary value rather than parity.
Decision impact: Investors should only back non-Anthropic bets that monetize budgets Anthropic ignores, because upside otherwise depends on Claude 2’s trajectory. Founders need to pitch themselves as extensions—data, safety, vertical UX—rather than replacements, since general assistant demand is already spoken for.
Dead Long Tail
Observation: The average tool sees 693k monthly visits while the median sits at zero across 354 products, proving most AI APIs never attract measurable usage.
Analysis: The mean is inflated by a handful of breakouts, so “average performance” stats mask that winners are statistical outliers. Reference customers, case studies, and advocates cluster around those same products, leaving the rest without social proof even if the tech works.
Decision impact: Go-to-market plans should emphasize partnerships, bundling, or embedding into incumbent workflows before chasing incremental features, because escaping the zero baseline organically is unlikely. Investors should discount any pitch leaning on category averages without direct or search traffic evidence.
Channel Playbooks
Observation: Direct traffic supplies 71% of AI API visits, search adds 25%, and referrals just 3%, so most developers land on vendors they already know.
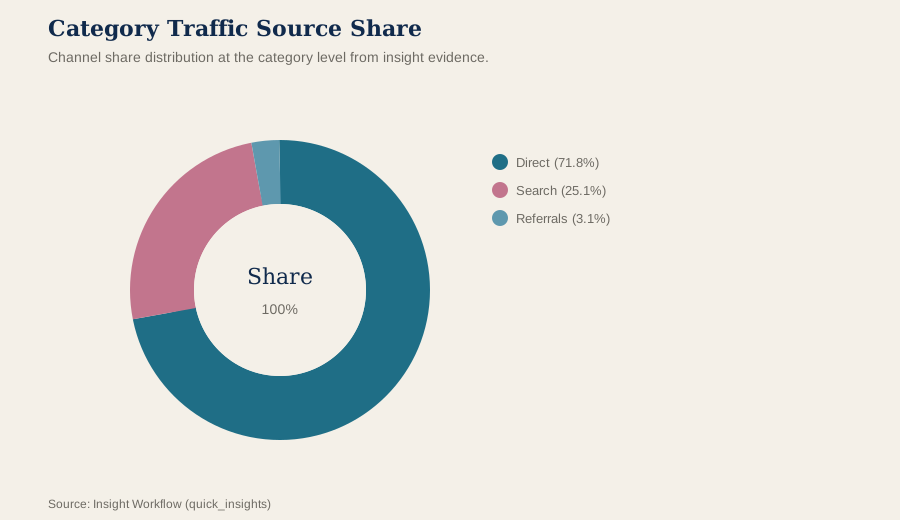
Channel share distribution at the category level from insight evidence.
Why it matters: Distribution rewards unforgettable brands and workflow integrations more than keyword work. Operator takeaway: Invest first in docs, demos, and integration showcases before search budgets.
Analysis: TopMediai relies on search for 69% of sessions with 25% direct, while Branded sits at 77% direct and 14% search, showing teams must pick either a pull-based SEO strategy or a push-based brand loop instead of splitting focus. SEO plays need constant content velocity; brand plays need concierge onboarding and community programs.
Decision impact: Product marketers should declare launches “brand-first” or “search-first” and align KPIs accordingly, because blended dashboards hide whether channel experiments work. Investors can qualify teams by asking if they can defend a direct share above the 71% benchmark or, if not, demonstrate keyword leadership on the intents they chase.
Russia Exposure
Observation: GPTunneL draws 73% of visits from Russia, 11% from Kazakhstan, and 4% from Belarus, tethering the tool to a sanctions-prone bloc.
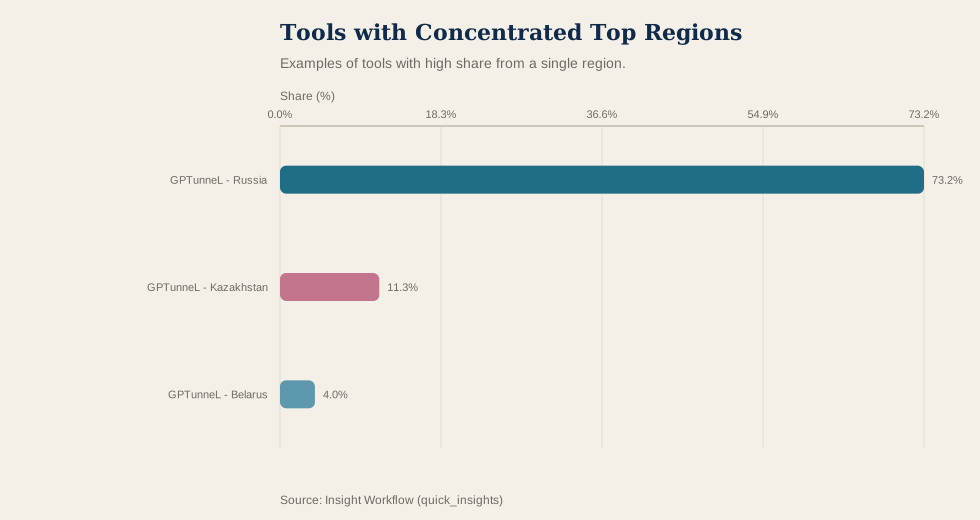
Examples of tools with high share from a single region.
Why it matters: A single geopolitical shock could erase most of GPTunneL’s business overnight. Operator takeaway: Build mirrors in neutral jurisdictions or design redundancy before promising global availability.
Analysis: Even if GPTunneL’s consumer access pitch lands locally, the heavy Russian mix guarantees red flags in multinational compliance reviews. The narrow footprint also hints that multilingual collateral, payments, and marketing outside the region have stalled or never launched, so expansion will be harder than translating the site.
Decision impact: Investors should treat GPTunneL as a regional yield play until traffic mixes broaden, with global expansion promises valued as out-of-the-money options. Developers depending on its API should support hot-swappable providers, because any regulatory disruption in Russia could strand downstream apps.
Momentum Split
Observation: They See Your Photos sits at 195k visits with 1.54× MoM growth, while Surgehq contracts to 0.64× and GPTunneL plus Grok Imagine fall −0.35 and −0.16 despite GPTunneL’s 833k base, highlighting sharp divergence between growers and shrinkers.
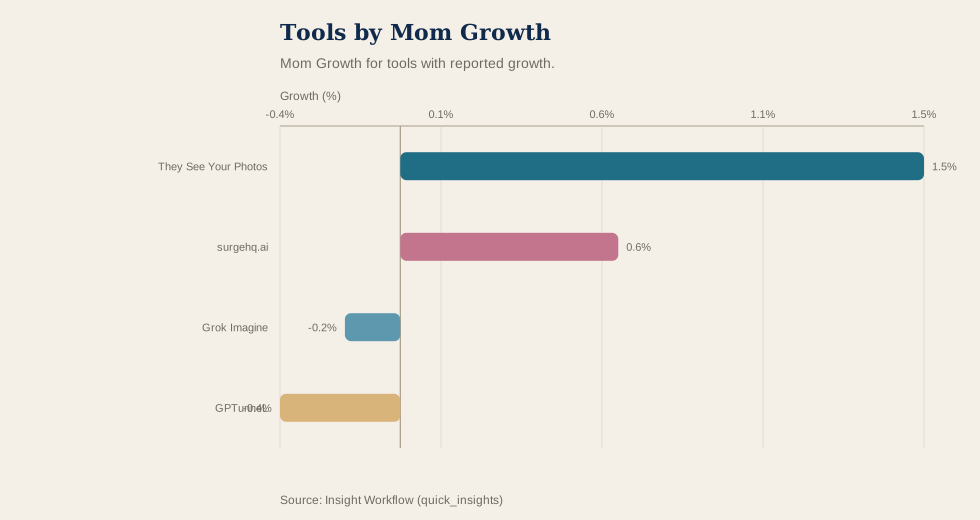
Mom Growth for tools with reported growth.
Why it matters: Growth and decline can flip within a single cycle regardless of absolute scale. Operator takeaway: Pair quantitative traffic monitors with narrative tracking before committing campaigns or capital.
Analysis: They See Your Photos offers privacy insights, and its limited SERP footprint suggests a greenfield API worth exploring before rankings solidify. Surgehq’s contraction with little SERP coverage signals weak sales efficiency. GPTunneL and Grok Imagine show that even scaled consumer APIs can hemorrhage users once compliance or novelty concerns surface, so instrumentation must track churn cohorts as closely as acquisition.
Decision impact: Developers should integrate They See Your Photos now to test visual-risk workflows before marketing noise rises, while PMs running GPTunneL- or Grok-like products must prioritize retention tooling over new features until the slide stops. Investors evaluating consumer APIs should demand evidence of stable cohorts or enterprise contracts before treating traffic scale as durable.
Music Keywords
Observation: Music-centric searches dominate the category: “elevenlabs” 2.6M visits, “suno” 2.2M, “suno ai” 1.2M, so general infrastructure APIs barely appear in search journeys.
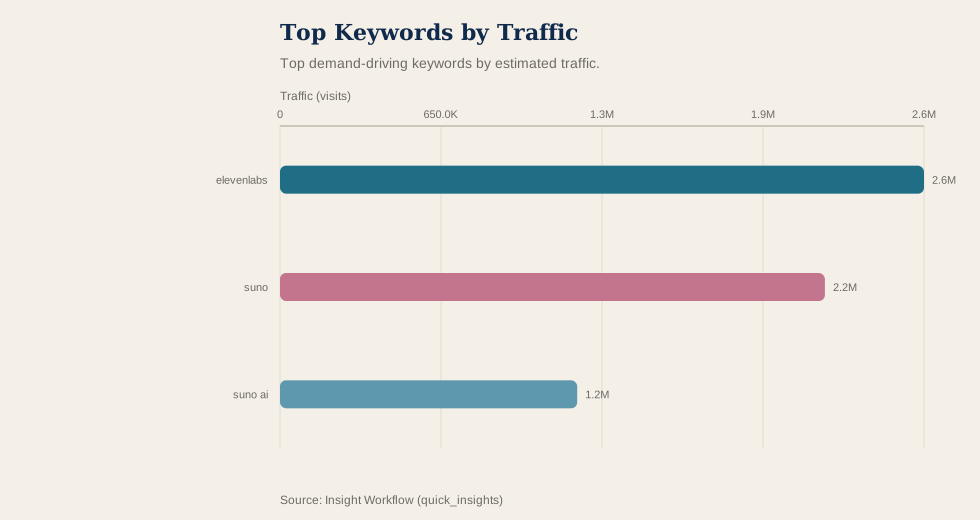
Top demand-driving keywords by estimated traffic.
Why it matters: Organic demand centers on a single creative workflow, starving other products of search oxygen. Operator takeaway: Build or partner into music-generation flows or stop budgeting for search-led acquisition.
Analysis: The fastest way to inherit discovery is to plug into ElevenLabs or Suno ecosystems because that is where intent already lives. Keyword concentration amplifies platform risk, since a policy or ranking change at one audio brand could wipe out a large share of category search traffic. Text- or data-focused APIs without an audio story will underperform in SEO regardless of documentation polish.
Decision impact: Treat music-aligned partnerships as prerequisites for search-driven roadmaps; if audio sits outside scope, reallocate funds to direct or referral channels. Founders should instrument analytics to separate branded music keywords from broader category intent so they can prove when they break beyond these anchor terms.
Rankings (Data Appendix)
Snapshot: current; tools in category: 354. MoM Growth is a ratio (0.147 = 14.7%). Shares are proportions (0.211 = 21.1%).
Visual Summary
Top tools by current monthly visits, sourced from insight evidence.
Mom Growth for tools with reported growth.
Channel share distribution at the category level from insight evidence.
Top 10 tools by Monthly Visits
Claude 2
Visits: 202,932,461
MoM: +17.5%
Search: 21.62%
Direct: 75.06%
Top Region: United States (31.52%)
klingai.com
Visits: 14,627,387
MoM: +8.6%
Search: 37.26%
Direct: 57.97%
Top Region: China (10.64%)
Branded
Visits: 4,223,304
MoM: +2.0%
Search: 13.86%
Direct: 77.25%
Top Region: United States (79.90%)
Tripo AI
Visits: 2,771,824
MoM: +50.8%
Search: 45.40%
Direct: 45.80%
Top Region: United States (11.37%)
Luma AI
Visits: 2,409,304
MoM: +17.5%
Search: 43.24%
Direct: 48.83%
Top Region: United States (12.07%)
Nano Banana Pro API - Kie.ai
Visits: 1,563,253
MoM: −7.2%
Search: 32.74%
Direct: 48.62%
Top Region: United States (16.34%)
Kie.ai: Affordable & Secure DeepSeek R1 API
Visits: 1,563,253
MoM: −7.2%
Search: 32.74%
Direct: 48.62%
Top Region: United States (16.34%)
Topmediai
Visits: 1,460,802
MoM: +4.5%
Search: 69.40%
Direct: 25.32%
Top Region: United States (14.90%)
Bigjpg
Visits: 1,458,815
MoM: −5.0%
Search: 38.85%
Direct: 54.61%
Top Region: China (17.76%)
Rodin
Visits: 1,275,494
MoM: −10.6%
Search: 51.01%
Direct: 40.42%
Top Region: United States (12.26%)
MoM Growth leaders (within top 50 by Monthly Visits)
They See Your Photos
Visits: 195,442
MoM: +154.0%
Search: 39.09%
Direct: 43.59%
Miragic Virtual Try-on Clothes
Visits: 45,141
MoM: +66.5%
Search: 40.98%
Direct: 37.11%
surgehq.ai
Visits: 256,807
MoM: +64.1%
Search: 44.79%
Direct: 42.51%
Sloyd
Visits: 340,795
MoM: +51.6%
Search: 52.31%
Direct: 35.16%
Tripo AI
Visits: 2,771,824
MoM: +50.8%
Search: 45.40%
Direct: 45.80%
Stable Horde
Visits: 44,100
MoM: +41.0%
Search: 42.85%
Direct: 38.21%
Avaturn ME
Visits: 161,002
MoM: +38.9%
Search: 49.35%
Direct: 35.79%
AltText.ai
Visits: 52,205
MoM: +30.8%
Search: 42.66%
Direct: 45.07%
Remove Bg
Visits: 36,138
MoM: +28.0%
Search: 47.19%
Direct: 35.92%
HTTPie AI
Visits: 122,800
MoM: +27.3%
Search: 46.62%
Direct: 38.39%
Top 3 (by Monthly Visits): Channel Mix
Claude 2
Visits: 202,932,461
Search: 21.62%
Direct: 75.06%
Referrals: 2.55%
Social: 0.50%
Display: 0.22%
Mail: 0.04%
klingai.com
Visits: 14,627,387
Search: 37.26%
Direct: 57.97%
Referrals: 3.16%
Social: 1.20%
Display: 0.38%
Mail: 0.03%
Branded
Visits: 4,223,304
Search: 13.86%
Direct: 77.25%
Referrals: 5.05%
Social: 1.05%
Display: 2.58%
Mail: 0.21%
Note: “—” means missing or zeroed in the input dataset.