Perplexity AI captures 170,053,376 monthly visits while Airtable AI|AI Answer

Using required compliance workflows before editing.
Executive Summary
Perplexity AI captures 170,053,376 monthly visits while Airtable AI Assistant and Genspark.ai reach 24,623,484 and 14,935,789, so only wedge products that dodge Perplexity's scope merit funding.
With 71.3% of traffic arriving directly, 24.7% via search, and 3.1% from referrals, the category already prices in brand intent, leaving little room for SEO-first launches.
The mean tool records 689,784 visits but the median is zero across 355 listings, so "category norms" are fantasy until a team proves it can break the long tail.
Keyword demand clusters around "mathgpt" (394,200 visits), "math ai" (197,100), and "math gpt" (169,500), forcing organic strategies to lean on computational tutoring narratives.
Mathful takes 64.14% of visits from search and 27.24% from direct, underscoring how single-channel dependence can erase growth once rankings wobble.
Glass.health at +139.1% MoM, exa.ai at +95.4%, and Sup AI at -23.9% show how violently leaders shuffle each month, so teams need agility budgets.
Dr.Tail's audience is 100% U.S. while Sup AI's is 64.7% domestic, highlighting the regulatory gravity of healthcare-aligned assistants.
Genspark.ai sources 27.9% of visits from South Korea, 25.6% from Japan, and 8.0% from the United States, positioning East Asia as the credible revenue path for travel and lifestyle copilots.
Winner Stack Compression
Perplexity AI's 170,053,376 visits versus Airtable AI Assistant's 24,623,484 and Genspark.ai's 14,935,789 show that the traffic ladder collapses after the leader, effectively creating an incumbent default before buyers compare features. Channel partners read the same signal and assume only Perplexity can guarantee top-of-funnel scale for generalized answering, so challengers must sell a wedge audience that Perplexity cannot prioritize.
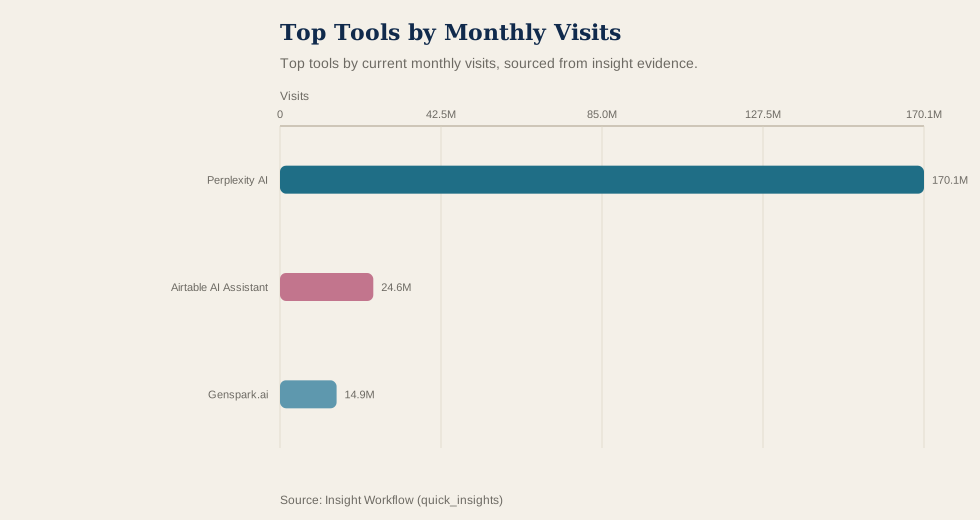
Top tools by current monthly visits, sourced from insight evidence.
Why it matters: The chart makes clear that visibility concentrates in one brand, so most entrants start invisible. Operator takeaway: Pitch a wedge workflow instead of mirroring Perplexity's scope.
Average monthly visits of 689,784 alongside a zero median across 355 tools confirm that category narratives are skewed toward a few breakouts while most listings have no measurable usage. Aggregated KPIs therefore hide the reality that "market growth" mostly reflects Perplexity's trajectory, making median-based benchmarking meaningless.
Builders and investors should fund only the initiatives with proprietary distribution or captive audiences, because otherwise the project either gets crushed by Perplexity or sinks into the zero-traffic long tail. Due diligence should focus on identifying tangible owned channels; without them, even polished products revert to the median of zero.
Direct-Heavy Access Costs
Category traffic is 71.3% direct, 24.7% search, and 3.1% referral, which means users already rely on bookmarks, apps, or type-ins rather than discovery flows. AI Answer tools behave like habit utilities, so go-to-market teams must pay for awareness or bundle their way into default status. SEO and referral programs now fight over a shrinking quarter of the pie, making generic acquisition campaigns low leverage.
Because direct intent dominates, CAC models resemble consumer subscription plays where paid awareness and bundling matter more than algorithmic tricks. The dataset effectively tells operators to manufacture trust signals; there is not enough ambient traffic to rely on organic discovery.
Teams should stack owned communication channels, enterprise bundles, or hardware tie-ins to manufacture habitual entry, while investors should haircut plans that depend on SEO when the dataset caps search at 24.7%. Product leaders evaluating vendors should ask whether their users already arrive directly, because integrations collapse when suppliers rely on volatile referrals.
Channel and Region Fault Lines
The baseline mix of 71.3% direct, 24.7% search, and 3.1% referral should be treated as a strategic guardrail rather than noise.
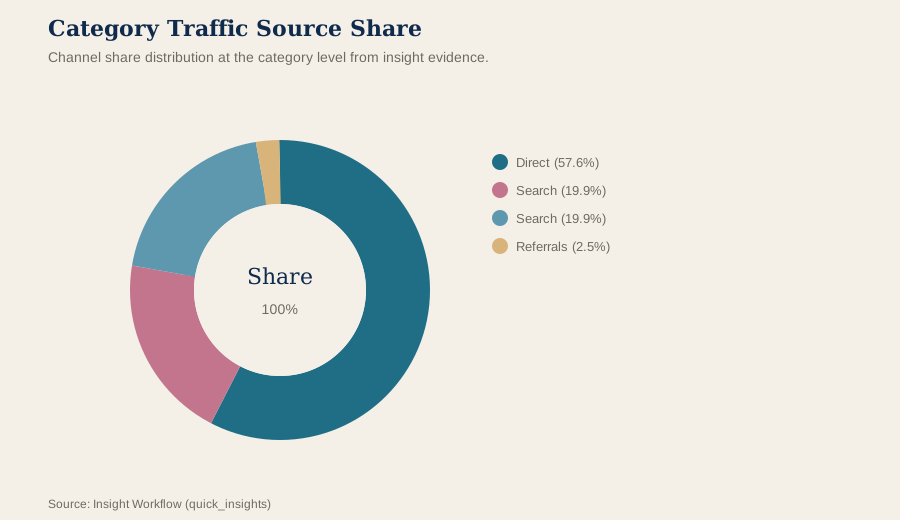
Channel share distribution at the category level from insight evidence.
Why it matters: The donut shows how little headroom exists outside direct access. Operator takeaway: Audit every portfolio company against this mix before greenlighting new marketing spend.
Mathful breaks the baseline with 64.14% of visits from search and 27.24% from direct, proving that channel-specific wins can scale but only by renting search real estate. This exposure demands rapid conversion of traffic into owned assets—curriculum partnerships, newsletters, or study communities—because a ranking drop would vaporize most of the funnel.
Dr.Tail draws 100% of its traffic from the United States while Sup AI is 64.7% domestic, showing that healthcare-adjacent assistants remain hostage to a single regulatory regime.
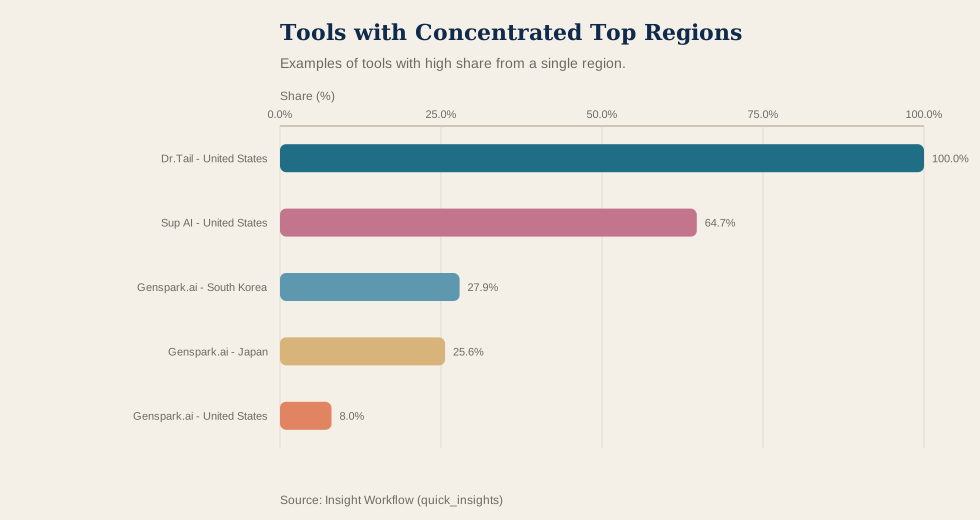
Examples of tools with high share from a single region.
Why it matters: The bar chart shows that even "global" AI services can be single-country bets, amplifying compliance and payer risk. Operator takeaway: Build commercialization plans around the dominant region before spending on localization.
Genspark.ai's 27.9% South Korean and 25.6% Japanese share, with only 8.0% from the United States, signals that some tools already operate as regional specialists. Expansion dollars should therefore follow the markets that already respond, with local editorial, support, and payment pods in East Asia before chasing U.S. parity.
Volatile Momentum Signals
Glass.health grew 139.1% month over month, exa.ai rose 95.4%, and Sup AI fell 23.9%, illustrating how quickly leaders trade places.
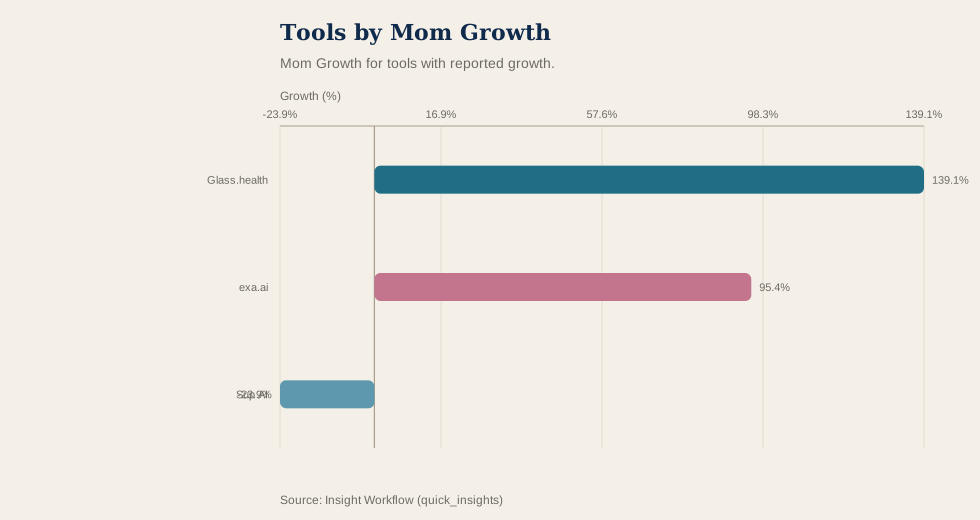
Mom Growth for tools with reported growth.
Why it matters: The bar chart juxtaposes surges and drops inside a single refresh, showing volatility as the norm. Operator takeaway: Run weekly instrumentation and budget reallocation cadences so teams can lean into spikes or cut during drawdowns without waiting for quarterly reviews.
The dataset lists no catalysts for Glass.health, Face Swap Solution Online, or exa.ai, so teams should treat big swings as alerts to inspect channel experiments rather than proof of new product-market fit. Developers need telemetry and modular architectures to exploit or survive surges of 139.1% or 95.4%, investors should value plans that flex spending instantly, and PMs need fallback experiences ready for Sup AI-style 23.9% corrections.
Keyword demand remains anchored on math queries—"mathgpt" (394,200 visits), "math ai" (197,100), and "math gpt" (169,500)—so organic traffic currently rewards computational tutoring assets over general chatbots.
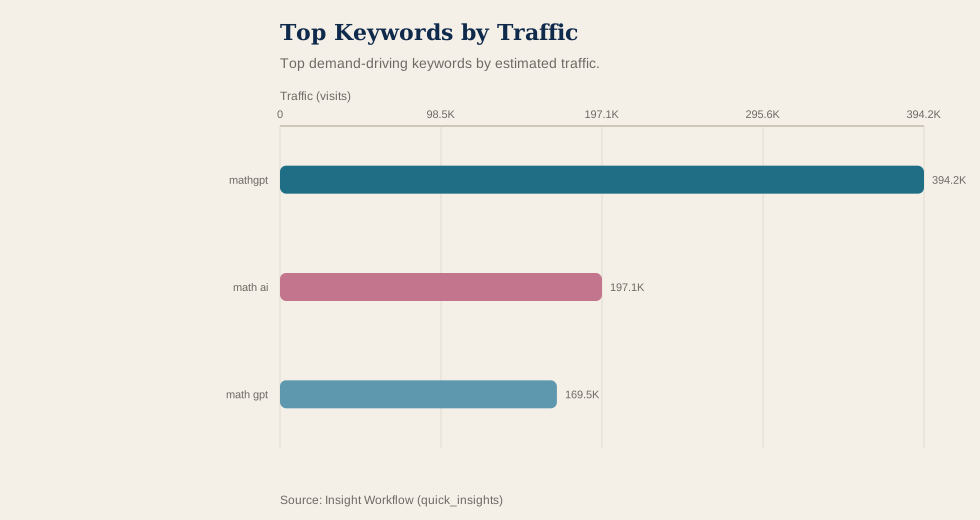
Top demand-driving keywords by estimated traffic.
Why it matters: The keyword chart shows how narrow the high-intent surface is today. Operator takeaway: Align SEO, influencer, and educational content around math mastery until demand broadens.
For developers, that keyword reality justifies investment in symbolic math solvers, step-by-step explainers, and assessment exports because they map to live searches. Investors should require math-specific authority signals in any organic-growth pitch, and PMs should treat non-math experiments as R&D budgets rather than core funnel assumptions.
Representative Plays
Perplexity AI's 170,053,376 visits, Mathful's 64.14% search share, and Genspark.ai's 27.9% South Korean plus 25.6% Japanese footprint show that leadership manifests as absolute scale, channel mastery, or regional specialization. Each archetype already commands a distinct promise—AI search depth for Perplexity, math tutoring leverage for Mathful, and travel sparkpages for Genspark.ai—without copying the others' roadmaps.
Perplexity's ownership of ingestion plus response loops demonstrates how search-style infrastructure turns traffic into habit. Mathful's tutoring scope shows the upside of riding math intent coupled with the fragility of search dependence. Genspark.ai's East Asian skew and Dr.Tail's 100% U.S. footprint prove that localization must be part of the thesis when categories touch travel planning or healthcare compliance.
Founders should decide early whether they are building Perplexity-scale infrastructure, a Mathful-style search magnet that converts into owned audiences, or a Genspark regional specialist that monetizes via local partners, because straddling the models yields neither scale nor defensibility. Investors and buyers should align diligence with the archetype—data supply chains and latency SLAs for Perplexity analogs, SEO-to-direct conversion plans for Mathful clones, and regulatory proof for Genspark or Dr.Tail bets—before underwriting multi-year commitments.
Rankings (Data Appendix)
Snapshot: current; tools in category: 355. MoM Growth is a ratio (e.g., 0.147 = 14.7%). Shares are proportions (e.g., 0.211 = 21.1%).
Visual Summary
Top tools by current monthly visits, sourced from insight evidence.
Mom Growth for tools with reported growth.
Channel share distribution at the category level from insight evidence.
Top 10 tools by Monthly Visits
Perplexity AI
Visits: 170,053,376
MoM: -5.3%
Search: 23.58%
Direct: 73.46%
Top Region: United States (20.19%)
Airtable AI Assistant
Visits: 24,623,484
MoM: +11.6%
Search: 14.95%
Direct: 76.04%
Top Region: United States (47.42%)
Genspark.ai
Visits: 14,935,789
MoM: +17.0%
Search: 32.21%
Direct: 64.45%
Top Region: South Korea (27.89%)
Poe
Visits: 11,568,203
MoM: -5.4%
Search: 25.26%
Direct: 71.42%
Top Region: Hong Kong, China (36.97%)
秘塔AI
Visits: 6,254,883
MoM: -8.3%
Search: 11.73%
Direct: 84.00%
Top Region: China (95.48%)
WolframAlpha
Visits: 3,576,669
MoM: -2.3%
Search: 49.87%
Direct: 45.96%
Top Region: United States (29.09%)
Dr.Oracle
Visits: 2,592,873
MoM: +12.1%
Search: 55.64%
Direct: 36.97%
Top Region: United States (53.59%)
Felo
Visits: 1,522,411
MoM: -22.0%
Search: 29.22%
Direct: 64.96%
Top Region: Japan (34.14%)
exa.ai
Visits: 1,502,077
MoM: +95.4%
Search: 36.83%
Direct: 51.31%
Top Region: United States (33.98%)
iAsk Ai Generative Ai Search Engine
Visits: 1,440,040
MoM: +7.3%
Search: 54.74%
Direct: 40.49%
Top Region: United States (40.43%)
MoM Growth leaders (within top 50 by Monthly Visits)
Medical Chat
Visits: 15,096
MoM: +315.9%
Search: 43.60%
Direct: 28.65%
Islam & AI
Visits: 45,062
MoM: +172.6%
Search: 45.63%
Direct: 39.28%
Glass.health
Visits: 123,251
MoM: +139.1%
Search: 27.73%
Direct: 63.42%
Face Swap Solution Online
Visits: 119,052
MoM: +128.0%
Search: 43.66%
Direct: 36.52%
exa.ai
Visits: 1,502,077
MoM: +95.4%
Search: 36.83%
Direct: 51.31%
Myreader AI
Visits: 73,106
MoM: +58.4%
Search: 49.59%
Direct: 37.48%
Bible Chat
Visits: 405,068
MoM: +52.9%
Search: 55.95%
Direct: 32.17%
Dream Interpreter
Visits: 83,129
MoM: +52.7%
Search: 48.21%
Direct: 38.69%
CommunityOne Discord AI Bot & Discord Analytics
Visits: 178,396
MoM: +52.2%
Search: 41.73%
Direct: 42.80%
Tettra
Visits: 25,859
MoM: +50.5%
Search: 21.50%
Direct: 67.54%
Top 3 (by Monthly Visits): Channel Mix
Perplexity AI
Visits: 170,053,376
Search: 23.58%
Direct: 73.46%
Referrals: 2.26%
Social: 0.41%
Display: 0.23%
Mail: 0.06%
Airtable AI Assistant
Visits: 24,623,484
Search: 14.95%
Direct: 76.04%
Referrals: 7.83%
Social: 0.76%
Display: 0.35%
Mail: 0.07%
Genspark.ai
Visits: 14,935,789
Search: 32.21%
Direct: 64.45%
Referrals: 2.56%
Social: 0.47%
Display: 0.29%
Mail: 0.01%
Note: "-" indicates missing or zeroed values in the source dataset.