AI Advertising Market Analysis Report

Executive Summary
Traffic consolidation remains extreme—Triple Whale and Adcreative.ai each exceed 1M monthly visits while the average tool is stuck at 36K, so stealing share demands prying budgets away from entrenched dashboards.
The median tool limps along at 654 visits even as the mean is 36K, confirming that most launches never cross minimal discovery thresholds and should not be funded on distribution narratives alone.
Omneky is the lone breakout pairing 294,626 visits with 35.3x YoY growth, making it the only sub-incumbent that warrants full market-entry diligence today.
theineedgroup.co.uk and HOLLYFY are posting triple-digit MoM spikes off tiny bases, signalling localized experiments rather than durable breakouts.
Search plus direct deliver just 48.1% of category traffic, leaving half the funnel dependent on volatile referrals or paid boosts and forcing developers to optimize for discoverability rather than loyalty.
Spain-, Canada-, and Italy-heavy demand clusters prove these tools are micro-market bets, so investors should underwrite localization budgets up front.
Six catalog entries show zero visits, so procurement teams must validate live activity before shortlisting any long-tail vendor.
Distribution Gravity Around Two Flagships
Because Triple Whale and Adcreative.ai are the only tools with truly scaled traffic, distribution gravity sits with two incumbents and makes marginal share expensive. Triple Whale draws 1,280,939 visits while Adcreative.ai pulls 1,001,888 against a 36,466 category average, underscoring the gap the rest of the catalog must close.
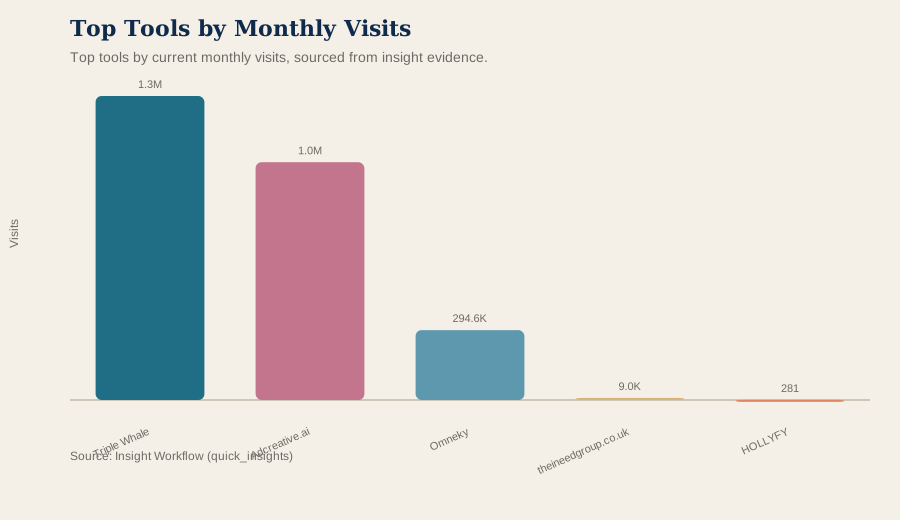
Top tools by current monthly visits, sourced from insight evidence.
Why it matters: The category effectively operates as a duopoly in audience reach, so budgets default to those two dashboards. Operator takeaway: Treat integrations or partnerships with these leaders as mandatory rail access rather than optional experiments.
The median tool records only 654 visits even though the mean sits at 36,466, proving the long tail lacks baseline discovery momentum. That 55x spread tells founders they cannot rely on passive marketplace exposure because user attention is already consolidated. As a result, investors should treat any plan that depends on organic directory traffic as suspect until the team shows proprietary acquisition loops.
Strategic buyers interpret the dominance at the top as evidence that only those leaders can reliably service enterprise creative cadences. That perception pushes developers toward building connectors or analytics overlays on top of the traffic hubs rather than chasing net-new distribution. Consequently, PMs should position challenger products as extensions to incumbent workflows if they want procurement attention.
Growth Signals Separate Scale from Spike
Omneky is the lone player combining breakout momentum with meaningful reach, positioning it as the next candidate to challenge the incumbents. Its 35.3x YoY surge pushed monthly visits to 294,626, a scale unmatched by other growers even if still below the top two.
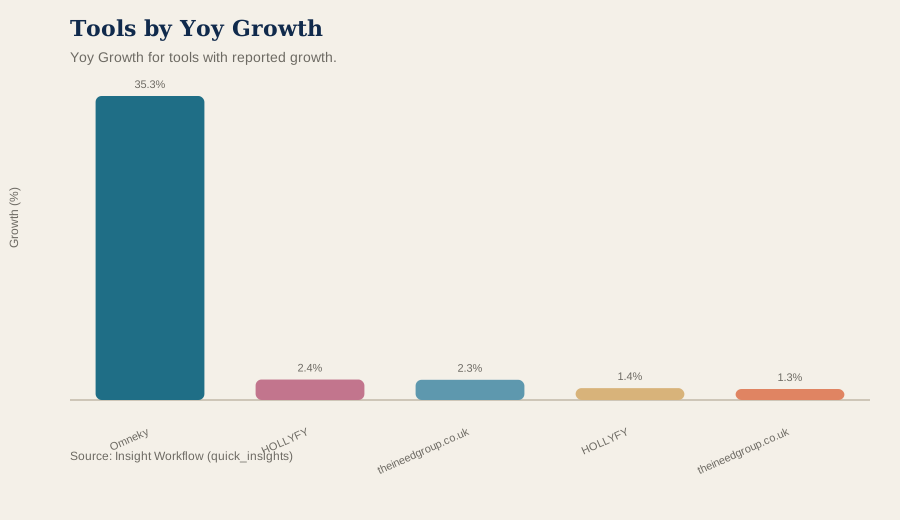
Yoy Growth for tools with reported growth.
Why it matters: Omneky's trajectory shows that sub-incumbents can still compound rapidly when they fix a distribution bottleneck. Operator takeaway: Investors and partners should interrogate Omneky's acquisition and product loops now before the window closes.
theineedgroup.co.uk posts 127.9% MoM and 234.3% YoY growth yet still sits at 8,989 visits, marking it as a localized surge rather than a scaled platform. Spain supplies 94% of its audience, so sustaining growth will require translations, compliance, and fresh channels to reach other markets. Therefore, developers and investors should treat it as proof that regionalized plays can spike quickly but demand incremental go-to-market spend before they scale.
HOLLYFY's 138.1% MoM and 238.6% YoY jumps come off a base of just 281 visits, underscoring a momentum story without real reach. Such tiny denominators mean that a single paid campaign or partnership can swing the growth rate, so analyses should focus on absolute traffic rather than percentage surges. Product teams should wait for sustained multi-month traffic before committing integrations, because the current signal-to-noise ratio is poor.
Channel Mix Shows Brand Fragility
Search and direct account for less than half of average traffic, keeping most tools dependent on volatile referral or paid channels instead of durable brand pull. Search contributes 23.4% and direct 24.7% of sessions on average, meaning that the majority of visits arrive through channels that can disappear if budgets or algorithms shift. Investors should price in higher acquisition costs and weaker customer stickiness because these businesses must keep refilling the funnel outside owned media.
With direct share stuck at 24.7%, developers cannot assume repeat logins and must deliver value on the first session. When nearly a quarter of traffic is search-led, many visitors arrive for single-job tasks, so structured creative specs and rapid output matter more than deep analytics. PMs should scope onboarding budgets toward instant templates and prebuilt platform exports that keep opportunistic visitors from bouncing.
For enterprise sellers, the search-heavy mix signals that buyers are still self-educating rather than leaning on reseller ecosystems. That reality keeps analyst relations, SEO-led content, and testing integrations relevant because prospects want proof of performance inside their optimization stack. Therefore, challengers should anchor go-to-market plans on provable experimentation hooks rather than assuming marketing automation partners will distribute them.
Regional Anchors Create Micro-Market Plays
Regional concentration remains extreme, with tools like theineedgroup.co.uk, zopmedia.com, and HelloScribe deriving between 80% and 100% of visits from single countries, so most offerings operate as micro-market bets rather than global platforms. Spain supplies 94% of traffic for theineedgroup.co.uk, Canada delivers 100% for zopmedia.com, and Italy accounts for 80% for HelloScribe, highlighting localized sales motions. Investors need to diligence language support, currency handling, and local compliance rather than assuming built-in global scalability.
These geographic pockets are also where the few meaningful growth spikes appear, as shown by Spain-heavy theineedgroup.co.uk leading both MoM and YoY gains. Local dominance lets PMs justify country-specific compliance and brand-kit tooling because homogenous buyers reward tailored experiences. Developers looking to copy this play should prioritize multi-language creative specs and region-aware workflows so they can redeploy a core engine into multiple markets without rewriting code.
For industry observers, this fragmentation means creative AI's convergence with media buying will likely debut in regional pilots before global rollouts. When 80–100% of a tool's traffic comes from a single country, it becomes easier to stitch campaign performance data back into the creative workflow because regulatory and channel variables stay constant. Consequently, watching regional leaders provides earlier warning of performance-integrated features than tracking the global incumbents alone.
Catalog Drag from Zero-Visit Tools
At least six listed tools—including Swipify, Dittto, bearkd.com, gena, adxcel.com, and Living Images—register zero monthly visits, revealing catalog drag that misleads buyers about active supply. While tracking gaps are possible, the cluster of zeroes suggests several vendors have effectively sunset without being removed from directories. Therefore, procurement teams and investors must demand live product demos or telemetry before considering any long-tail vendor credible.
This inactivity is especially dangerous in a distribution-skewed category because it inflates the appearance of choice while real demand funnels into the same top performers. For developers, that means misjudging the competitive landscape and underestimating how much differentiation is required to win share from incumbents. As a result, product managers should treat marketplace listings as a starting point and run their own user interviews or benchmarks to weed out dormant entries.
Ecosystem partners that build integrations blindly risk wasting cycles on tools without users, so they need ongoing traffic monitoring gates. Given that the median active tool only attracts 654 visits, any listing below that mark is unlikely to deliver meaningful usage for an integration partnership. Ad networks and analytics providers should instead prioritize co-marketing with the handful of tools that demonstrate real traffic to maximize mutual impact.
Rankings (Data Appendix)
Snapshot: current; tools in category: 394. MoM Growth is a growth ratio (e.g., 0.147 = 14.7%). Shares are proportions (e.g., 0.211 = 21.1%).
Visual Summary
Top tools by current monthly visits, sourced from insight evidence.
Yoy Growth for tools with reported growth.
Top 3 tools by Monthly Visits
Bluepear Brand Bidding Detection Tool
Visits: 10,959
MoM: -11.7%
Search: 40.56%
Direct: 39.11%
Top Region: United States (21.37%)
ad:personam Self Serve DSP
Visits: 5,845
MoM: -21.8%
Search: 21.84%
Direct: 63.94%
Top Region: United States (42.20%)
Hifen.io
Visits: 830
MoM: +439.0%
Search: 42.63%
Direct: 36.25%
Top Region: Brazil (100.00%)
MoM Growth leaders (within top 3 by Monthly Visits)
Hifen.io
Visits: 830
MoM: +439.0%
Search: 42.63%
Direct: 36.25%
Bluepear Brand Bidding Detection Tool
Visits: 10,959
MoM: -11.7%
Search: 40.56%
Direct: 39.11%
ad:personam Self Serve DSP
Visits: 5,845
MoM: -21.8%
Search: 21.84%
Direct: 63.94%
Top 3 (by Monthly Visits): Channel Mix
Bluepear Brand Bidding Detection Tool
Visits: 10,959
Search: 40.56%
Direct: 39.11%
Referrals: 13.02%
Social: 5.27%
Display: 1.86%
Mail: 0.17%
ad:personam Self Serve DSP
Visits: 5,845
Search: 21.84%
Direct: 63.94%
Referrals: 7.69%
Social: 5.36%
Display: 1.04%
Mail: 0.13%
Hifen.io
Visits: 830
Search: 42.63%
Direct: 36.25%
Referrals: 13.52%
Social: 5.67%
Display: 1.71%
Mail: 0.22%
Note: '—' means missing/zeroed in the input dataset.