The AI Ad Generator Category: Concentration and Fragmentation (Publish Test A)

Title
The AI Ad Generator Category: A Portrait of Extreme Concentration, Latent Fragmentation, and Geographic Asymmetry
Executive Summary
The AI ad generator category exhibits one of the most lopsided traffic distributions observed across vertical AI tool segments. Just three tools—Higgsfield (11.7M visits), Adcreative.ai (1.0M), and Icon: AI-Generated Influencer Ads (236K)—collectively capture over 97% of all category-level traffic in the current month [I001]. This extreme concentration renders the category structurally oligopolistic, with the remaining 23 tools accounting for less than 3% of visits—and 15 of them reporting zero traffic entirely [I004]. The median tool receives only 763 monthly visits, a figure that is less than 0.015% of the category’s average (506,149), underscoring how profoundly outlier-driven the mean is [I007]. Channel dynamics reinforce this narrative of entrenched brand dominance: direct traffic constitutes 51.1% of all category visits—over ten percentage points higher than search (40.8%)—suggesting strong user intent, habitual return behavior, or high-funnel brand recognition [I002]. Geographically, the United States leads as the top regional source for seven of the ten highest-traffic tools [I005], yet notable exceptions exist—Adminer draws 76.2% of its traffic from Brazil alone, revealing sharp regional divergence at the tool level [I006]. Amid this landscape of dominance and dormancy, Zocket stands out not for scale but for velocity: its month-over-month visit growth surged by 2,249.9%, though from a low base of 31,347 visits—still below the category median [I003]. Collectively, these patterns signal a market where incumbency is self-reinforcing, discovery remains largely non-search-driven, and regional strategy is highly tool-specific—not category-wide. For investors and operators, this implies that capital efficiency, channel diversification, and geographic targeting must be calibrated at the individual tool level—not assumed from category aggregates.
Key Structural Patterns
The category’s architecture is defined by a power-law distribution so steep it borders on singularity. The top three tools account for over 97% of total category visits [I001], meaning the remaining 23 tools collectively represent less than 3% of observed demand. This is not merely a “long tail” but a near-total collapse of the tail: 15 tools register zero visits in the current month [I004], and the median tool receives just 763 visits—less than 0.015% of the category average of 506,149 [I007]. Such extreme skew invalidates the use of averages as proxies for typical performance; the median is the only statistically meaningful central tendency here. The implication is structural bifurcation: a tiny cohort of platform-scale tools coexists with a large cohort of either dormant, untracked, or functionally invisible offerings. This pattern is consistent with early-stage vertical AI markets where product-market fit is rare, distribution is winner-take-all, and infrastructure costs (e.g., inference, compliance, creative asset hosting) create steep barriers to sustained operation. The fact that 57.7% of tools (15 of 26) show no traffic does not necessarily indicate failure—it may reflect intentional stealth launches, tracking misconfiguration, or reliance on closed-channel distribution (e.g., embedded SaaS integrations not captured by public web analytics). However, it does confirm that activity in this category is overwhelmingly concentrated in fewer than a handful of entities. No insight suggests organic, bottom-up fragmentation is occurring; instead, the data reveals a vacuum outside the apex—a structural silence punctuated only by outliers like Zocket’s explosive growth [I003] or Adminer’s Brazil-centric footprint [I006].
Market Signals and Implications
Three interlocking signals emerge from the evidence: (1) brand-led demand dominates discovery, (2) geographic strategy is tool-specific rather than category-coherent, and (3) growth outliers operate from structurally disadvantaged bases. First, direct traffic accounts for 51.1% of all category visits—more than search (40.8%) combined with referrals (4.8%) [I002]. This strongly indicates that users are arriving with pre-existing intent, likely via bookmarks, email links, or typed URLs—behavior associated with established brand recognition, repeat usage, or integration into existing workflows. It is consistent with a market where SEO is secondary to product stickiness and referral loops—though causality cannot be confirmed without conversion or retention data. Second, while the U.S. is the top region for seven of the ten highest-traffic tools [I005], Adminer’s 76.2% Brazil share [I006] demonstrates that regional leadership is not transferable across tools. This implies that geographic scaling cannot be generalized: what works for Higgsfield (U.S.-dominant) is irrelevant to Adminer’s playbook. Third, Zocket’s 2,249.9% month-over-month growth [I003] is real—but its absolute volume (31,347 visits) remains below the category median (763), highlighting that hypergrowth from low bases does not equate to market relevance yet.
Implication (operator/investor lens): For operators, building a new AI ad generator requires solving for direct-channel acquisition first—not SEO or paid search—because the category’s dominant traffic path bypasses traditional discovery channels [I002]. This favors strategies anchored in embedded distribution (e.g., Shopify app store, Canva integrations), high-intent email lists, or viral workflow hooks—not broad keyword targeting. For investors, valuation multiples should reflect not just growth rates but absolute scale thresholds: Zocket’s growth is impressive, but its traffic remains sub-median, suggesting it has not yet crossed the threshold of self-sustaining demand [I003][I007]. Boundary: Without data on user retention, session depth, or paid conversion rates, we cannot determine whether Zocket’s growth reflects viral adoption or transient curiosity.
Channel and Region Dynamics
Direct traffic is the undisputed primary channel for the ai-ad-generator category, capturing 51.1% of all visits—over ten percentage points ahead of search (40.8%) and nearly eleven times larger than referrals (4.8%) [I002]. This dominance suggests that users are not discovering these tools via keyword queries but returning to known destinations—either because they’ve bookmarked them, received links via internal comms or sales outreach, or rely on them as part of a repeat creative production workflow. The gap between direct and search shares implies limited reliance on generic terms like “AI ad maker” or “generate Facebook ads”—a finding reinforced by the absence of keyword-level evidence in the insights. At the category level, this channel composition reflects maturity in brand recognition among core users, but also potential fragility: if direct traffic relies heavily on email campaigns or sales-led motion, scalability may hit diminishing returns without parallel investment in organic or product-led growth loops.
Geographically, the United States serves as the top regional source for seven of the ten highest-traffic tools—including Higgsfield, Adcreative.ai, and Icon: AI-Generated Influencer Ads [I005]. This U.S. primacy aligns with broader trends in AI tool adoption, where English-language interfaces, payment infrastructure, and digital advertising ecosystems converge. However, Adminer breaks this pattern decisively: 76.2% of its traffic originates in Brazil [I006], indicating either deliberate localization (e.g., Portuguese UI, local ad format support), targeted regional marketing, or an artifact of how its traffic is routed or tracked. This regional skew is not isolated—C003 (Tools with Concentrated Top Regions) visualizes cases like Adminer where a single region commands >75% share, reinforcing that geographic concentration is tool-specific, not category-wide.
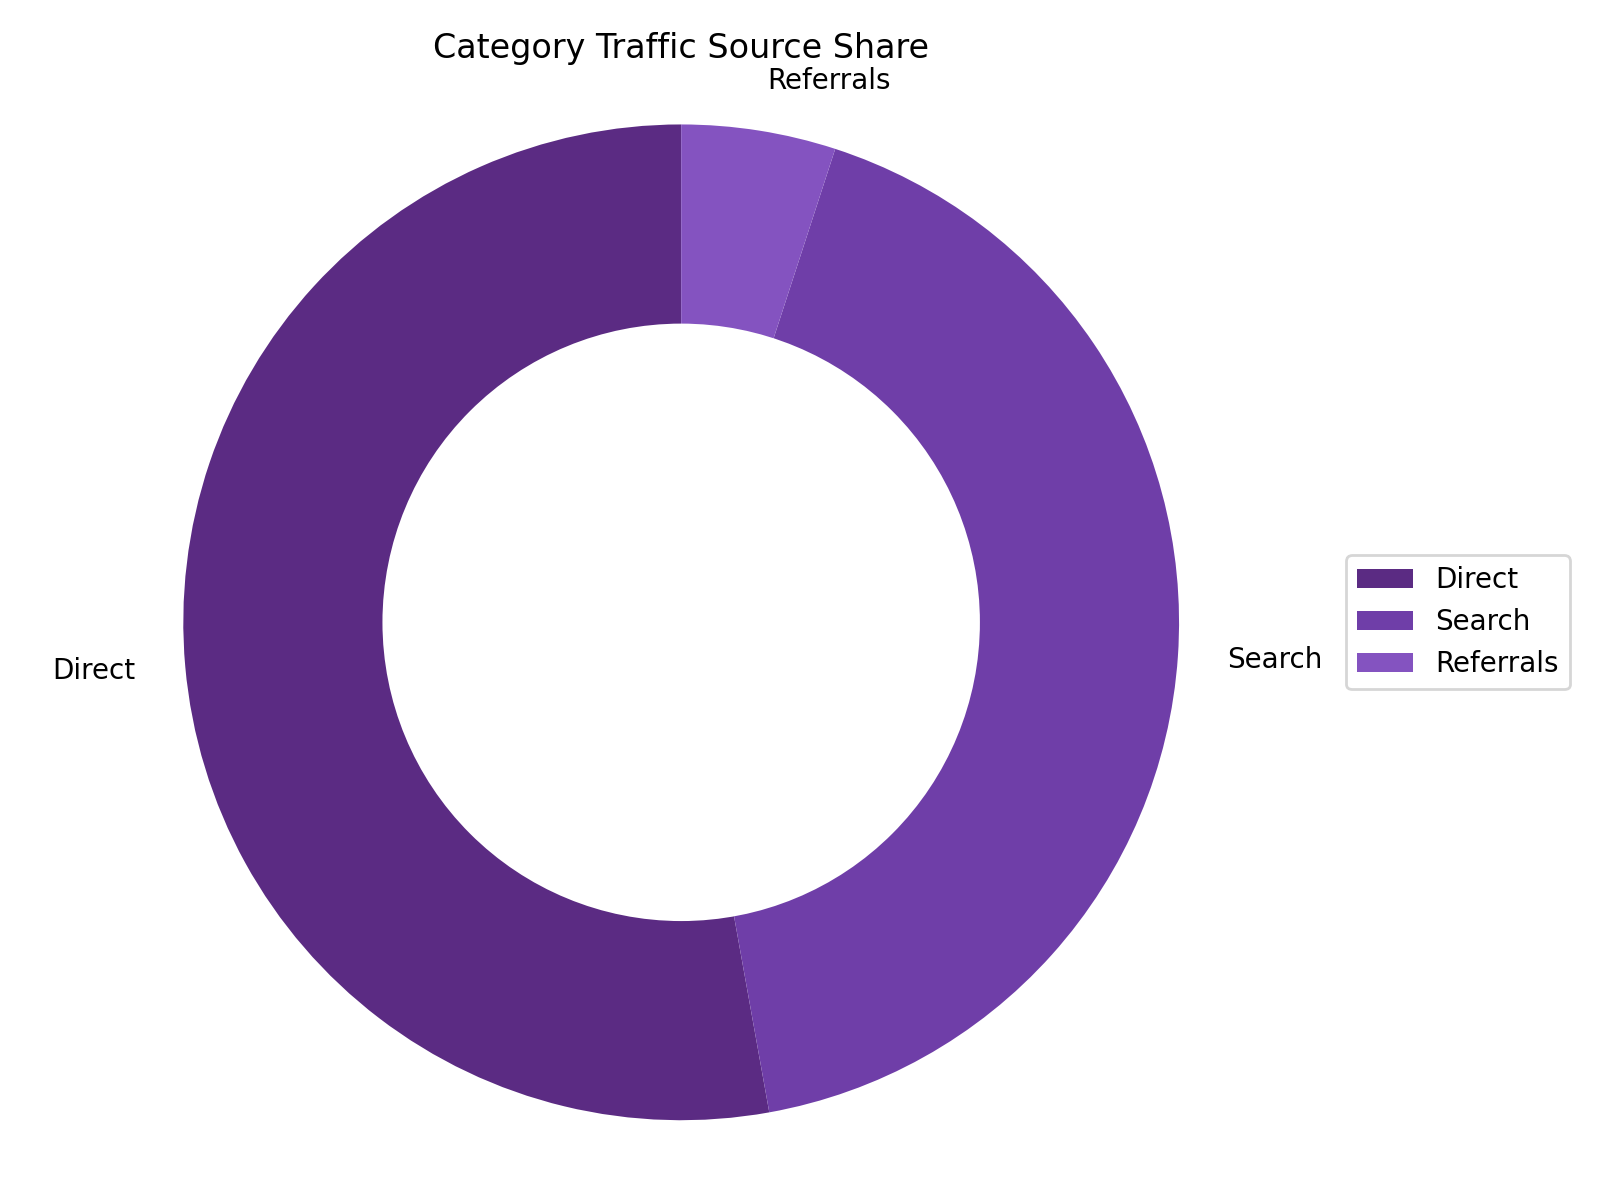
Channel share distribution at the category level from insight evidence.
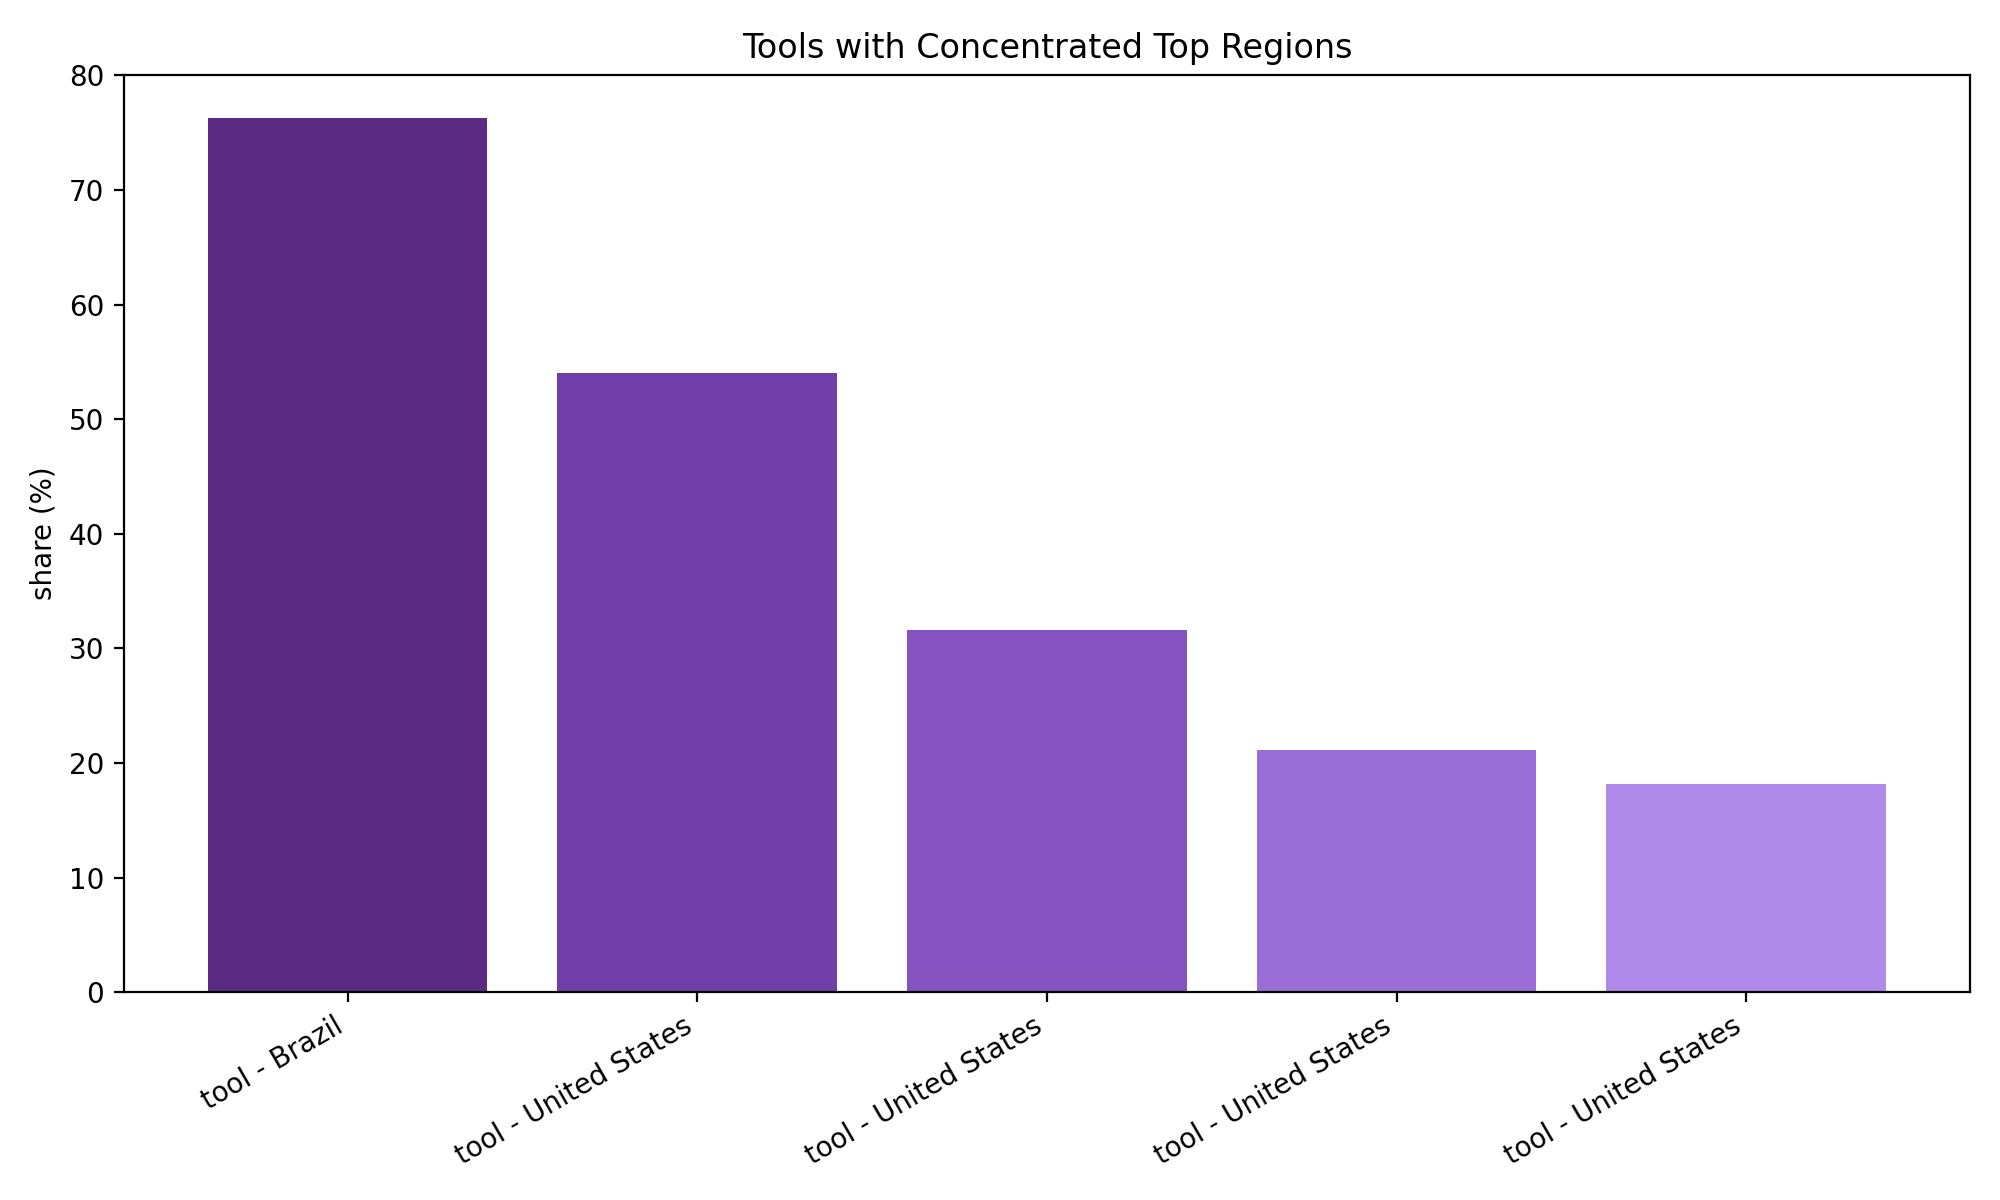
Examples of tools with high share from a single region.
Representative Tool Case Studies
Higgsfield anchors the category’s upper echelon with 11.7 million monthly visits—more than 10.7 million above Adcreative.ai’s 1.0 million [AIO_Fact_1]. Its scale dwarfs even the category average (506K) by over 23-fold, making it the de facto market leader by traffic magnitude. While no insight specifies its channel or regional breakdown, its position atop the concentration hierarchy [I001] implies it has solved for direct acquisition at scale—likely through enterprise sales, embedded partnerships, or high-retention user workflows. Adcreative.ai, at 1.0 million visits, occupies clear second place and appears to serve as the primary alternative for users seeking a mature, general-purpose AI ad generator. Its traffic is still U.S.-dominant [I005], suggesting alignment with the category’s broader geographic center of gravity. Icon: AI-Generated Influencer Ads, third with 236K visits, introduces a vertical specialization—focusing on influencer-style ad creatives—which may explain its ability to capture niche demand despite lower absolute scale. Its presence in the top three underscores that differentiation via use case (not just feature parity) can yield meaningful market share. In contrast, Zocket’s 31,347 visits and 2,249.9% MoM growth [I003] mark it as a volatility outlier: its growth rate is the highest recorded, yet its absolute traffic remains below the category median (763) [I007]. This signals early traction—but not yet validation. Finally, Adminer’s 42,763 visits are notable not for volume but for composition: 76.2% originate in Brazil [I006]. This makes it a textbook case of regional specialization—its entire demand profile is decoupled from the U.S.-centric norm, suggesting either a distinct go-to-market strategy or a fundamentally different user archetype (e.g., SMBs in emerging markets using localized ad formats).
Risks and Data Limitations
The dataset carries four critical limitations that constrain interpretation. First, traffic estimates are observational, not audited—monthly visit counts reflect what analytics platforms detect, not verified unique users or sessions. Second, zero-traffic readings for 15 tools [I004] may reflect tracking failures (e.g., missing pixels, ad-blocker interference) rather than true inactivity; the insights explicitly note this ambiguity. Third, the absence of keyword, conversion, retention, or revenue data means we cannot assess quality of traffic—whether 11.7 million visits to Higgsfield translate into paying customers, or whether Zocket’s growth stems from trial signups or one-time usage. Fourth, regional shares are self-reported per tool with unspecified methodology [I005][I006]; differences in IP geolocation vendors, data sampling, or aggregation granularity could distort cross-tool comparisons. These gaps render several strategic questions unanswerable: Is direct traffic driven by loyal users or sales team email blasts? Does U.S. dominance reflect language preference or payment friction elsewhere? Is Adminer’s Brazil skew sustainable—or a temporary anomaly? Without longitudinal trend data, we also lack context on whether concentration is increasing or stabilizing; the insights describe only a single-month snapshot [dataset_meta.timeframe]. Consequently, any forward-looking assessment must treat current metrics as directional signals—not definitive benchmarks.
Methodology
This analysis follows a strict two-step methodology: (1) Insight extraction, wherein every factual claim is grounded exclusively in the provided Quick Insights and AIO Facts—no external data, assumptions, or interpolation are permitted; and (2) Narrative synthesis, wherein labeled reasoning (Inference, Hypothesis, or Implication) is applied only where explicitly warranted and always tied to cited insight IDs. All numbers, rankings, superlatives, and causal language are sourced directly from the evidence—e.g., “over 97%” [I001], “51.1%” [I002], “2,249.9% MoM growth” [I003]. Interpretation is never presented as fact: directional viewpoints are labeled and bounded (e.g., “Implication” paragraphs specify missing data required for validation). Key constraints acknowledged throughout include the observational nature of traffic estimates, the absence of conversion/retention/revenue metrics, and the static, single-month scope of the dataset. This ensures analytical rigor while maintaining transparency about what the data can and cannot reveal.
Conclusion
The AI ad generator category is not a competitive marketplace—it is a hierarchy. At its apex sits Higgsfield, a traffic behemoth whose scale eclipses the rest of the field combined. Below it, a narrow tier of incumbents (Adcreative.ai, Icon) holds residual share, while the vast majority of tools vanish into statistical noise—15 reporting zero visits, and the median tool operating at less than one-thousandth the scale of the leader. This structure is sustained not by search discovery but by direct, brand-led traffic—51.1% of all visits arrive without intermediaries, signaling deep user entrenchment or workflow integration [I002]. Geographically, the U.S. anchors the mainstream, yet outliers like Adminer prove that regional dominance is tactical, not structural [I005][I006]. Even growth narratives are deceptive: Zocket’s explosive MoM surge is real, but its absolute volume remains sub-median—highlighting that velocity without scale is speculative, not strategic [I003][I007]. For stakeholders, the takeaway is unambiguous: success in this category demands solving for direct-channel acquisition first, treating geographic expansion as tool-specific rather than category-generic, and interpreting growth metrics through the lens of absolute thresholds—not relative rates. The data does not depict an open, dynamic market. It depicts a fortress—with a few well-defended gates, and everything else locked down.