AI Ad Creative Market Analysis Report

Executive Summary - Inference — Power remains locked in the top three tools, whose combined share hits 52.4%, limiting oxygen for the remaining 128 solutions. - Inference — Adcreative.ai alone draws 1,001,888 visits while the category average sits at 41,794, underscoring a structural scale moat. - Inference — Direct navigation now edges search (44.6% vs 42.8%), so distribution is brand-led instead of SEO-led. - Inference — Nine of the top ten tools lean on the United States as their #1 region, flagging geographic over-dependence. - Inference — Zocket’s +2249.9% monthly growth to 31,347 visits marks the lone breakout wedge even though absolute traffic remains modest. - Implication — Five tools losing more than 24% of visits in one month signals fragile demand, so operators need contingency channel plans. Boundary: Only single-month MoM data is provided, so decline duration is unknown. - Inference — Social contributes just 3.9% of category traffic and mail is negligible, meaning creative discovery is not yet community-distributed. - Inference — Identical 322,632-visit counts for AI Image Translator, AI Ad Library, and Pipiads hint at reporting artifacts that can mask real share shifts.
Scale Concentration Reshapes AI Ad Creative Hierarchy
Inference — Category power curve hardened as the top three control majority of attention. Evidence: Adcreative.ai captured 1,001,888 visits while Atria and Predis each cleared 410,000, yielding 52.4% combined share. What changed: The rest of the field now orbits an order-of-magnitude smaller average, widening the perception gap between incumbents and the tail. Implication: Scale acts as a defensive moat, so differentiation must come from format specialization rather than volume warfare.
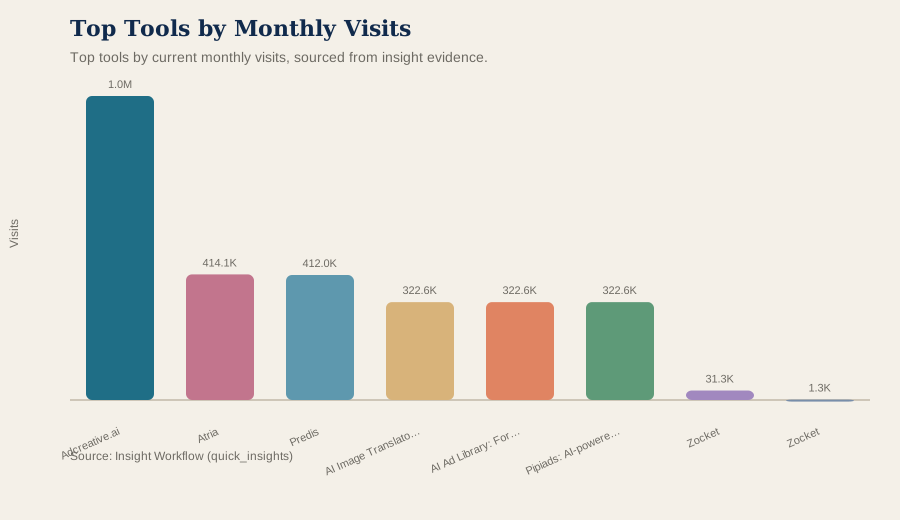
Top tools by current monthly visits, sourced from insight evidence.
Why it matters: The chart highlights how little surface area remains for organic discovery climbs. Operator takeaway: Anchor go-to-market plans on niche channels or partnerships instead of attacking incumbents head-on.
Inference — Adcreative.ai’s lead over the category average reframes budget conversations around inevitability rather than experimentation. Evidence: The tool brings in 1,001,888 monthly visits compared with a 41,794 average, creating a steep credibility gradient when marketers evaluate vendors. What changed: Buyers increasingly default to incumbents for brand-safe creative automation, forcing challengers to prove unique outputs before even landing pilots. Implication: Emerging vendors should lean into platform- or workflow-specific outcomes instead of pitching generalized creative studios.
Inference — Mid-tier symmetry, evidenced by three separate tools reporting the same 322,632 visits, indicates either shared acquisition funnels or dataset artifacts that blur differentiation. Evidence: AI Image Translator for Ecom Image, AI Ad Library, and Pipiads all post 322,632 visits this month despite promising different advertiser jobs-to-be-done. What changed: When analytics collapses multiple properties into a single traffic band, narrative oxygen for each brand erodes because analysts cannot prove unique momentum. Implication: Teams behind these properties must over-communicate feature depth or integrations to avoid being bucketed as interchangeable utilities.
Implication — Consolidation at the top plus measurement ambiguity in the middle forces investors to treat most AI creative pitches as channel-specific bets rather than scalable platforms. Evidence: Distribution data shows a narrow trio capturing the bulk of visits while multiple mid-tier tools even share identical visit prints, implying limited standalone gravity. What changed: Without clear numerical separation in the mid-market, capital allocation decisions now hinge on verifiable integrations or IP rather than traffic narratives. Implication: Expect diligence to prioritize proof of differentiated creative specs or campaign data feedback loops before funding expansion plans. Boundary: The dataset covers traffic only, so product usage depth and revenue retention remain unobserved.
Channel And Region Dynamics Redefine Acquisition Spend
Inference — Direct navigation now leads all channels, signaling that buyers remember tool URLs rather than discovering them via search. Evidence: Direct share sits at 44.6% versus 42.8% for search while social remains under 4%. What changed: With direct overtaking search, incremental acquisition now depends more on brand experiences or retained bookmarks than keyword arbitrage. Implication: Founders must budget for brand marketing or partner distribution instead of assuming SEO alone can carry acquisition.
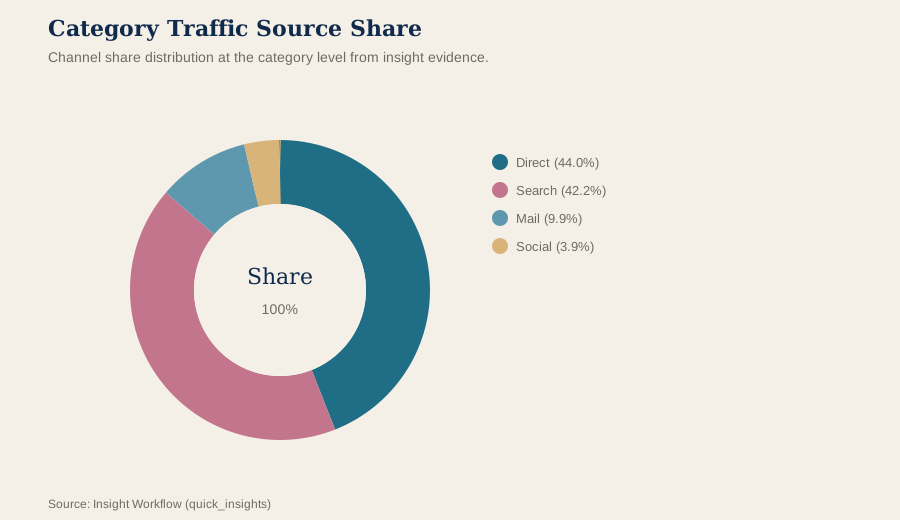
Channel share distribution at the category level from insight evidence.
Why it matters: The channel mix clarifies why new entrants struggle to displace incumbent mindshare. Operator takeaway: Invest in account-based outreach or integration-led referrals to recreate direct intent faster.
Inference — A direct-first funnel reduces developer-friendly API pull because teams seek end-to-end creative studios rather than modular tooling. Evidence: When nearly half of visitors arrive via direct navigation, they signal pre-existing tool familiarity instead of component shopping, which deprioritizes commodity APIs. What changed: Platform buyers increasingly treat AI creative suites as systems of record, compressing the window for plug-in entrants. Implication: API-forward builders should target adjacent workflows such as testing or analytics, then backdoor into creative generation instead of pitching as yet another studio.
Inference — The United States anchoring nine of the ten most visited tools reveals a narrow geographic footprint that caps upside for marketers chasing emerging-market channels. Evidence: U.S. audiences rank first for Adcreative.ai, Atria, Predis, and OTTO Google Ads, mirroring the rest of the top cohort. What changed: Without visible non-U.S. strongholds, platform diversification into LatAm or APAC advertisers remains speculative rather than data-backed. Implication: Growth teams should pilot localized templates or partnerships abroad now, before incumbent media-buying platforms clone these feature sets in-market.
Implication — Investors evaluating AI creative vendors should discount projections that rely on global expansion or organic community virality because neither shows up in current traffic flows. Evidence: Direct navigation dominates category traffic while U.S. visitors lead nine of the top ten tools, leaving little proof of international or social-led pull. What changed: Expansion theses now require tangible localization spend or reseller ecosystems rather than extrapolation from domestic demand. Implication: Capital should underwrite ventures with explicit distribution wedges—such as non-English model support or embedded campaign workflow APIs—before valuing TAM claims. Boundary: No region-level data is supplied for the long tail of 121 tools, so hidden regional champions could exist outside the top cohort.
Volatility Maps Emerging Opportunity And Risk
Inference — Traffic momentum is bipolar, with one breakout gainer offset by multiple double-digit decliners in the same month. Evidence: Zocket spiked +2249.9% month-over-month to 31,347 visits while five peers fell more than 24%. What changed: Growth narratives now hinge on the ability to engineer spikes without instantly decaying, exposing the fragility of acquisition hacks. Implication: Operators should treat experiments as disposable scrims and over-invest in retention bridges before momentum reverses.
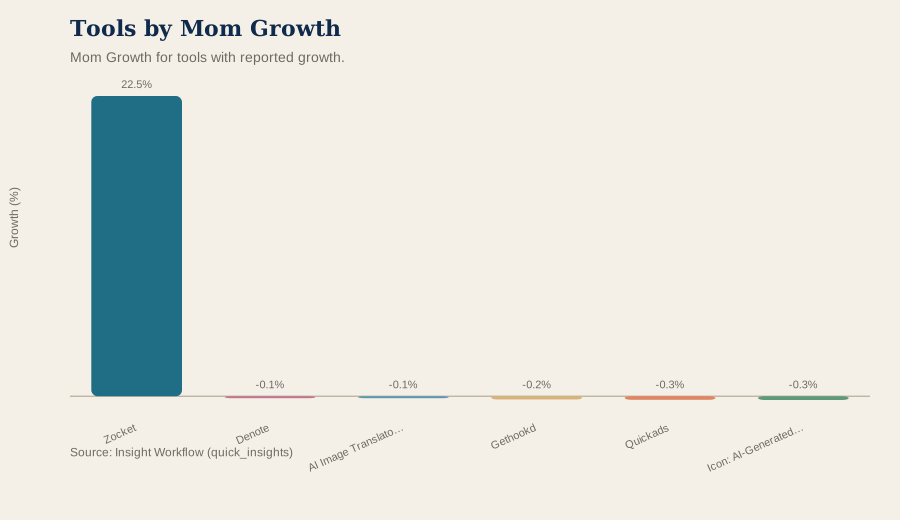
Mom Growth for tools with reported growth.
Why it matters: The growth histogram shows how erratic distribution remains, so teams must expect sharp reversals. Operator takeaway: Pair every spike campaign with downstream nurtures—newsletter capture, agency partnerships, or SDK embeds—to bank upside.
Inference — Zocket’s surge is meaningful as an opportunity signal precisely because it materialized from a tiny base, making it a live test of whether niche positioning can puncture incumbents. Evidence: The product vaulted from 1,306 to 31,347 visits in a single month, proving that even small teams can momentarily break through among 131 tracked tools. What changed: Category observers now see that storytelling around a specific creative pain point can unlock meaningful attention if distribution is tightly orchestrated. Implication: Builders should catalog the tactics behind this spike and industrialize the repeatable pieces before larger suites copy the narrative.
Inference — The simultaneous 24%+ declines at Gethookd, Icon, Denote, Quickads, and Bestever underline how quickly algorithms or paid channels can turn against AI creative vendors. Evidence: Each of these tools surrendered at least a quarter of its traffic in one month, erasing tens of thousands of sessions in aggregate. What changed: The category now exhibits visible downside volatility, signaling that creative fatigue hits the platforms themselves when acquisition loops stagnate. Implication: Product managers must build alerting around lead-source mix so they can re-balance toward partnerships or community programs before paid efficiency collapses.
Implication — Developers, investors, and PMs should read the current volatility as a mandate to couple creative generation with measurable campaign loops instead of shipping stand-alone asset studios. Evidence: The only breakout (Zocket) and the steepest laggards (Gethookd et al.) both underscore that growth lives or dies by distribution agility, not by marginal model improvements. What changed: Stakeholders now have proof that tools tied to transient campaigns can rocket or crater within 30 days, so durable value will accrue to platforms embedding testing APIs or automated experiment reporting. Implication: Developers should expose batch-generation endpoints, investors should diligence channel diversification roadmaps, and PMs should bind creative output to performance telemetry before rolling out new SKUs. Boundary: The dataset lacks retention or revenue metrics, so we cannot confirm whether volatility translates into paid churn.
Hypothesis — If subsequent months show similar outlier swings, the market will bifurcate into a few capitalized roll-ups that can amortize acquisition risk across multiple tools. Evidence: A single spike and five major drops already demonstrate how uneven distribution is at current scale. What changed: Observers now anticipate that sustainable navigation might require portfolio strategies rather than solo products. Implication: Expect accelerators and holding companies to scout for tuck-in deals that diversify channel bets once more data confirms the pattern. Boundary: Only one month of momentum data is available, so consolidation pressure remains speculative.
Representative Tool Case Studies
Inference — Adcreative.ai exemplifies the enterprise-leaning tier that couples massive traffic with presumed feature breadth, making it the benchmark for PMs evaluating compliance, brand kits, or video ambitions. Evidence: With 1,001,888 visits this month, it stands far above the 41,794 average, suggesting entrenched procurement cycles and deep content libraries. What changed: Enterprise buyers will increasingly use Adcreative’s visibility as a proxy for best-in-class, raising the proof bar for smaller vendors claiming comparable capabilities. Implication: Competing products must showcase superior verticalization—TikTok-native specs, rights-clearance workflows, or API depth—to earn meetings.
Inference — Atria and Predis illustrate the upper-mid tier that already commands hundreds of thousands of visits yet still trails the category leader, implying room for challenger positioning that emphasizes differentiated channel expertise. Evidence: Each tool logs just over 410,000 monthly visits, placing them firmly inside the top three but still less than half of Adcreative.ai’s reach. What changed: Their scale confirms that a dual-track market exists—enterprise-grade but not yet monopolistic—creating acquisition targets for platforms wanting instant share in AI-driven creative automation. Implication: Operators at these companies should harden reseller and agency ecosystems now to avoid getting boxed into price wars as consolidation heats up.
Inference — Zocket serves as the clearest SMB-focused case study showing that even a modest visit count can unlock investor interest when paired with exponential momentum. Evidence: The product scaled from 1,306 to 31,347 visits in one month, a trajectory rarely seen among the 131 tools tracked. What changed: That growth burst proves there is appetite for AI creative tooling tailored to narrow campaign types if onboarding friction stays minimal. Implication: Founders targeting SMB advertisers should copy Zocket’s time-to-value cues—prebaked templates and simplified launch flows—and instrument cohorts immediately to learn whether the spike is durable.
Inference — Quickads represents the counterexample where a quarter of traffic evaporated, showing that recognized names can lose relevance when acquisition loops stall. Evidence: The tool recorded a -26.6% MoM drop, placing it among the steepest fallers alongside Gethookd and Icon. What changed: Advertisers now have tangible proof that AI-powered ad builders can fall out of favor within weeks, reducing switching costs for enterprise buyers who demand experimentation optionality. Implication: PMs should pair launch roadmaps with churn insurance—bundled training, usage-based pricing, or integrated analytics—so a single channel hiccup doesn’t crater pipeline.
Implication — The trio of AI Image Translator, AI Ad Library, and Pipiads—each posting the same 322,632 visits—should be treated cautiously in competitive benchmarking because the symmetry muddies both market share and operational focus. Evidence: Despite different value propositions, all three show identical visit counts and one even reports a -10.7% MoM contraction, implying potential aggregation effects. What changed: Analysts can no longer rely on raw traffic alone to separate these brands, complicating partnership and acquisition decisions. Implication: Conduct qualitative diligence on their customer mixes and data sources before assuming any one of them has defensible traction. Boundary: The dataset does not explain whether the identical counts stem from shared analytics providers or actual user overlap, so duplication risk remains unresolved.
Skill usage: Brainstorming — applied upfront to structure the memo flow; no additional clarifications required.
Rankings (Data Appendix)
Snapshot: current month; tools in category: 131. MoM Growth is a growth ratio (e.g., 0.147 = 14.7%). Shares are proportions (e.g., 0.211 = 21.1%).
Visual Summary
Top tools by current monthly visits, sourced from insight evidence.
Mom Growth for tools with reported growth.
Channel share distribution at the category level from insight evidence.
Top 0 tools by Monthly Visits
No tools with non-zero monthly visits in dataset.
MoM Growth leaders (within top 0 by Monthly Visits)
No tools with valid MoM growth in this base set.
Top 3 (by Monthly Visits): Channel Mix
No top tools available for channel comparison.
Note: '—' means missing/zeroed in the input dataset.