Ad Copy Tools Market Analysis Report

Executive Summary
Traffic in the Ad Copy Tools market is highly concentrated: Atria, marpipe.com, Blobr account for 91.8% of observed monthly visits.
Search is the largest traffic channel for 6 of the top 9 tools in the current dataset, which makes this a search-led acquisition market at the traffic level.
This month is volatile: marpipe.com grew +15.1%, while Adbot - Your Search Ads Specialist fell -62.9%. Those moves are useful signals, but single-month MoM changes do not establish structural shifts on their own.
The United States is the top observed region for 5 of the top 9 tools. That supports a US-concentrated reading of current traffic, but it does not prove that non-US demand is absent.
5 of 14 tracked tools report zero visits, which means the visible market is narrower than the raw category count suggests.
Atria is the traffic benchmark at 387,127 monthly visits, while Adinspiration shows the most extreme channel concentration with 50.35% search share and 30.07% direct share.
Rankings (Data Appendix)
Snapshot: current month; tools in category: 35. MoM Growth is a growth ratio (e.g., 0.147 = 14.7%). Shares are proportions (e.g., 0.211 = 21.1%).
Visual Summary
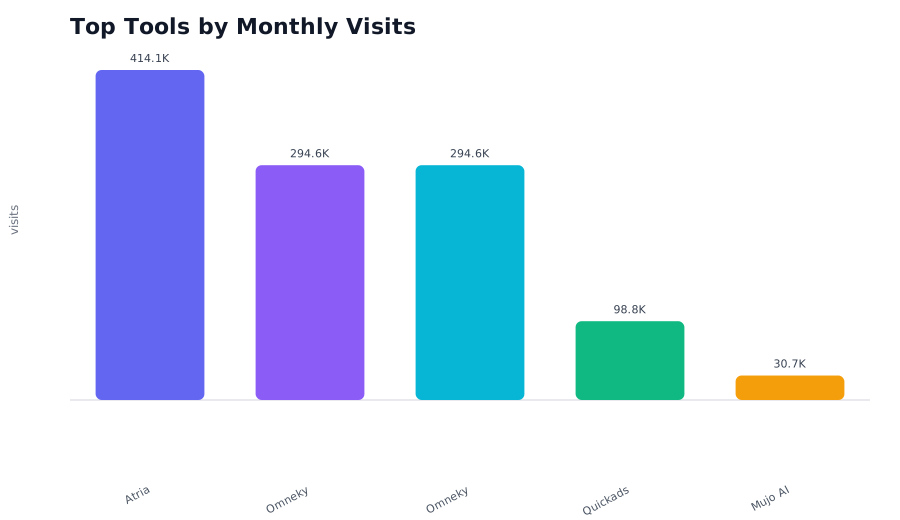
Top tools by current monthly visits, sourced from insight evidence.
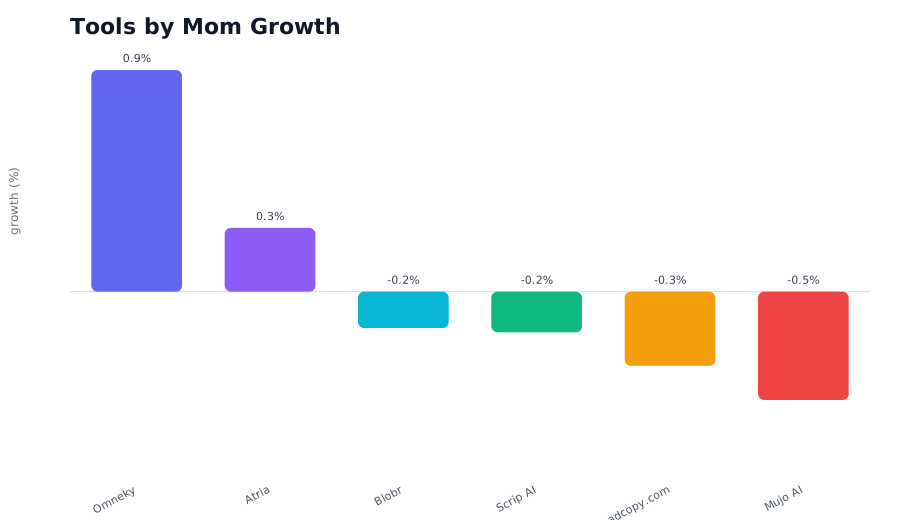
Mom Growth for tools with reported growth.
Top 9 tools by Monthly Visits
Atria
Visits: 387,127
MoM: +12.3%
Search: 29.52%
Direct: 61.27%
Top Region: United States (33.38%)
marpipe.com
Visits: 89,549
MoM: +15.1%
Search: 41.56%
Direct: 38.83%
Top Region: United States (17.59%)
Blobr
Visits: 53,831
MoM: +9.8%
Search: 50.21%
Direct: 35.59%
Top Region: United States (15.38%)
30characters
Visits: 21,754
MoM: +2.4%
Search: 29.53%
Direct: 48.55%
Top Region: United States (23.79%)
freeadcopy.com
Visits: 20,129
MoM: -23.1%
Search: 34.44%
Direct: 49.77%
Top Region: United States (43.68%)
Google SERP Simulator
Visits: 3,785
MoM: +0.3%
Search: 44.98%
Direct: 38.51%
Top Region: Australia (35.81%)
Adbot - Your Search Ads Specialist
Visits: 878
MoM: -62.9%
Search: 39.23%
Direct: 38.33%
Top Region: Brazil (38.75%)
AdCopy.ai
Visits: 501
MoM: 0.0%
Search: 42.37%
Direct: 36.48%
Top Region: Brazil (100.00%)
Adinspiration
Visits: 297
MoM: 0.0%
Search: 50.35%
Direct: 30.07%
Top Region: Honduras (100.00%)
MoM Growth leaders (within top 9 by Monthly Visits)
marpipe.com
Visits: 89,549
MoM: +15.1%
Search: 41.56%
Direct: 38.83%
Atria
Visits: 387,127
MoM: +12.3%
Search: 29.52%
Direct: 61.27%
Blobr
Visits: 53,831
MoM: +9.8%
Search: 50.21%
Direct: 35.59%
30characters
Visits: 21,754
MoM: +2.4%
Search: 29.53%
Direct: 48.55%
Google SERP Simulator
Visits: 3,785
MoM: +0.3%
Search: 44.98%
Direct: 38.51%
AdCopy.ai
Visits: 501
MoM: 0.0%
Search: 42.37%
Direct: 36.48%
Adinspiration
Visits: 297
MoM: 0.0%
Search: 50.35%
Direct: 30.07%
freeadcopy.com
Visits: 20,129
MoM: -23.1%
Search: 34.44%
Direct: 49.77%
Adbot - Your Search Ads Specialist
Visits: 878
MoM: -62.9%
Search: 39.23%
Direct: 38.33%
Top 3 (by Monthly Visits): Channel Mix
Atria
Visits: 387,127
Search: 29.52%
Direct: 61.27%
Referrals: 5.89%
Social: 2.56%
Display: 0.63%
Mail: 0.11%
marpipe.com
Visits: 89,549
Search: 41.56%
Direct: 38.83%
Referrals: 11.83%
Social: 6.59%
Display: 1.05%
Mail: 0.15%
Blobr
Visits: 53,831
Search: 50.21%
Direct: 35.59%
Referrals: 8.78%
Social: 4.29%
Display: 1.02%
Mail: 0.11%
Note: '—' means missing/zeroed in the input dataset.
Market Structure
The current dataset describes a concentrated market rather than a broad, evenly distributed one. The top three tools alone account for 91.8% of observed monthly visits, and Atria leads by a wide margin at 387,127 monthly visits. That makes traffic concentration the clearest structural fact in the category.
The long tail is also weakly validated. 5 of 14 tracked tools report zero visits, so raw tool count overstates how many products are visibly competing for traffic. In practical terms, the active market is smaller than the category label implies.
Top tools by current monthly visits, sourced from insight evidence.
Acquisition Mix
Search is the dominant acquisition channel for 6 of the top 9 tools, while direct traffic leads only for Atria, 30characters, freeadcopy.com. That supports a search-led acquisition reading in the current dataset, but it does not reveal whether discovery comes from branded, category, or long-tail queries.
MoM changes are better read as volatility signals than as diagnoses. marpipe.com posted +15.1% MoM growth, while Adbot - Your Search Ads Specialist posted -62.9%. Without a longer time series or external event context, those swings are notable but not conclusive.
Mom Growth for tools with reported growth.
Product Form Factors
When tools are assigned a primary product archetype, this category still splits into distinct shapes. The heaviest traffic sits in two primary poles: model-native creation (0.0%; examples: Vora) and ad-performance tooling (99.3%; examples: Atria, marpipe.com, Blobr). That split matters because the leaders are not all selling "AI video generation" in the same way: some sell access/control over frontier models, while others sell ad-ready output and video ads.
A smaller but still visible layer is emerging around bundled platforms and editor-style products. Suite-style positioning is currently marginal in the top cohort, while editor/copilot framing (0.0% primary (+9.3% secondary); example: Blobr), which suggests the market is expanding from raw generation into multi-step production environments.
Workflow Signals
The workflow center of gravity is still upstream. Most visible tools are focused on making the asset itself (text-to-video, image-to-video, avatar-led UGC, ad creative generation), while true distribution or coordination workflow shows up mainly in tools like Atria. In other words, the category has more creative production than campaign orchestration.
That makes PostSyncer notable for a reason beyond its traffic drop: it represents the scheduling/team-collaboration path, whereas tools like Atria, marpipe.com, Blobr stay closer to creative output and performance use cases. Workflow capability also appears as a secondary layer in about 67.0% of observed traffic, which suggests bundling pressure is rising but not yet dominant. The interesting trend is not "more features" in the abstract; it is a split between creation-first tools and workflow-bundling tools.
Commercial Positioning
Commercially, the summaries split into three pitches. One pitch is creator or model-native experimentation (for example Vora), one is explicit advertiser ROI language (Atria, marpipe.com, Blobr), and one is platform consolidation (Vidguru). That is more interesting than a generic "AI video" category label because it shows different buyers already pulling the market in different directions.
The sharper reading is that performance-marketing language is becoming the clearest business framing, while model-native language still captures outsized attention when tied to a breakout platform like Sora. Generalist suites and editor-style tools are present, but for now they look more like breadth bets than the main traffic engine.
Region Signals
The United States is the top observed region for most of the leading tools (5 of the top 9). At the same time, the dataset still shows some non-US top-region examples, including Google SERP Simulator (Australia), Adbot - Your Search Ads Specialist (Brazil), AdCopy.ai (Brazil), Adinspiration (Honduras). The safer reading is concentration, not absence: the current traffic picture skews US-heavy, but top-region data alone cannot rule out meaningful demand elsewhere.
Because the region field only identifies the top observed market for each tool, it should be used as a directional signal rather than a full geography map. It is strong enough to flag concentration, but not strong enough to support hard claims about international GTM viability.
Representative Tools
Atria: What it does: AI-powered ad workflow platform for revenue growth. Observed traffic: 387,127 monthly visits, +12.3% MoM, 29.52% search share, and top region United States. Interpretation: this is the traffic benchmark for the category, but the dataset still describes discovery and concentration rather than conversion or retention.
Adbot - Your Search Ads Specialist: What it does: Adbot automates and optimizes online advertising campaigns using AI for small businesses. Observed traffic: 878 monthly visits and -62.9% MoM. Interpretation: this month shows a sharp traffic decline, which is important to monitor, but without longer history or external event context it is safer to treat it as a volatility signal than as proof of structural product weakness.
Adinspiration: What it does: Ad templates for Meta ads to boost conversions. Observed traffic: 297 monthly visits, 0.0% MoM, and 50.35% search share. Interpretation: this is the clearest example of channel concentration in the dataset. It indicates dependence on search visibility, but not necessarily weak retention or low product value.